 Click on the Category button to get more articles regarding that product.
Exchange HealthChecker.ps1 reports error
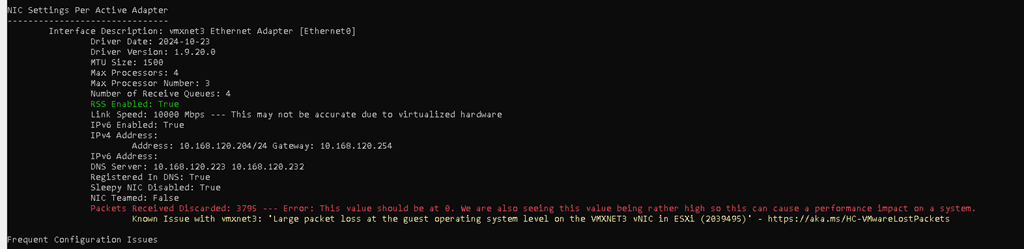
Packets Received Discarded: xx — Error: This value should be at 0. We are also seeing this value being rather high so this can cause a performance impact on a system. Known Issue with vmxnet3: ‘Large packet loss at the guest operating system level on the VMXNET3 vNIC in ESXi (2039495)
When using the VMXNET3 driver on a virtual machine on ESX, you see significant packet loss during periods of very high traffic bursts. The virtual machine may even freeze entirely. Doing one of the following may resolve the issue:
- vMotion the VM to another host
- Disconnect and reconnect the VM’s adapter
- Performance degradation VDI or other virtual machines
HealthChecker Error: Packets Loss Check
Description:
We check if there are any PacketsReceivedDiscarded logged for the NIC. Large package loss can cause a performance impact on a system and should be investigated and fixed.
- Good:
PacketsReceivedDiscardedis0 - Warning:
PacketsReceivedDiscardedlower than1000 - Error:
PacketsReceivedDiscardedgreater than1000
NOTE: This counter is accumulation from reboot, or if the NIC setting was changed, so the counter can be stale for some time. However, even though you might not be actively dropping packets, the counter should be at 0 in a healthy environment.
|
Here is the Exchange HealthChecker.ps1 script which has led us to the VMware article over time.
|
|
Extract from HealthChecker.ps1 analyse on Exchange Subscription Edition NIC Settings Per Active Adapter |
|
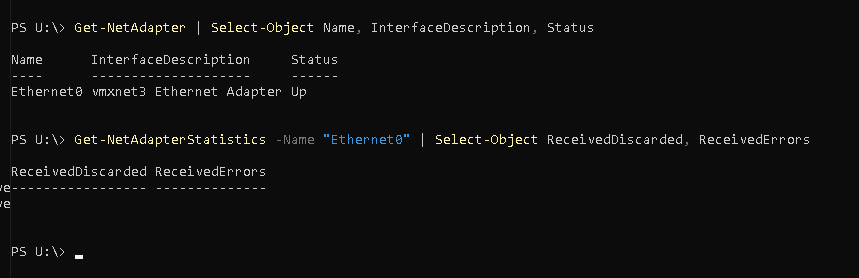
On the server itself you may not see those errors. Some values are empty/null/zero. So we know from this that the error are BELOW the Microsoft OS. (ESX, Physical NIC, vSwitch, physical Switch connected to ESX) Get-NetAdapter | Select-Object Name, InterfaceDescription, Status Get-NetAdapterStatistics -Name “Ethernet0” | Select-Object ReceivedDiscarded, ReceivedErrors |
 |
We had to find out some values to diagnose. This posts helps find those.That is why you have to diagnose on the ESX.
|
Application (Robocopy,exe or VEEAM Agent) |
Packet loss in the guest OS using VMXNET3 in ESXi | https://knowledge.broadcom.com/external/article?legacyId=2039495
To run the diagnose on ESX CLI you need the “Switch Name” an the “PortNumber” of the affected server.
shows the ESXi VMXNET3 backend view (between the virtual NIC and the ESXi network stack).
vsish -e get /net/portsets/<Switch Name>/ports/<PortNumber>/vmxnet3/rxSummary | grep "running out of buffers"vsish -e get /net/portsets/<Switch Name>/ports/<PortNumber>/vmxnet3/rxSummary | grep "1st ring"
* Find out on which ESX Host the Exchange runs
* Enable SSH on the ESX so you can diagnose on the GUI
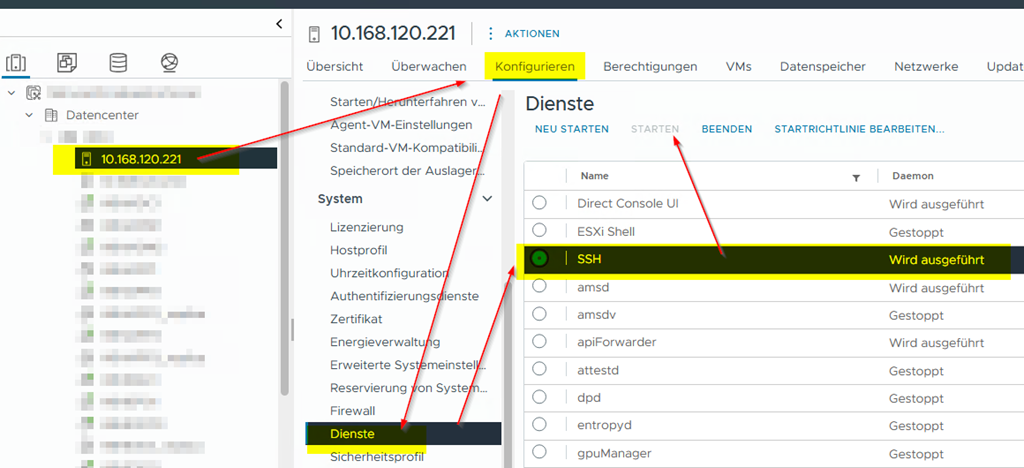
Let’s first check what NIC the Server CHEXC19 uses in GUI.
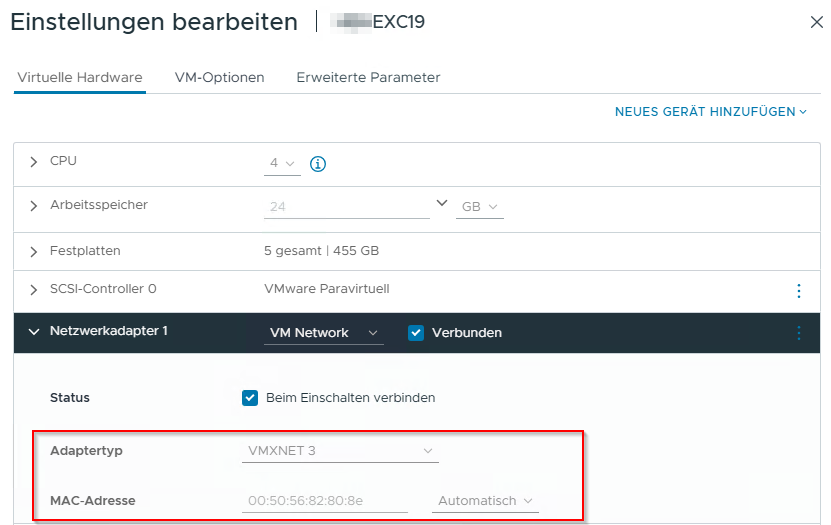
Putty/SSH to the ESX server
First try:
| net-stats -l | grep -i CHEXC19 |
|
[root@CHESX01:~] net-stats -l | grep -i HBHEXC19 (PORT Number) (Virtual Switch) |
Now we need the “port ID or Number” and the “vSwitch” from the world for those two diagnose commands:
vsish -e get /net/portsets/<Switch Name>/ports/<PortNumber>/vmxnet3/rxSummary | grep "running out of buffers"vsish -e get /net/portsets/<Switch Name>/ports/<PortNumber>/vmxnet3/rxSummary | grep "1st ring"
If the commands work > fine you got the right Port and VSwitch. Otherwise get the info in another way.
|
We need to find out in which world the servers lives. Let us list all servers and find CHEXC19. esxcli network vm list |
|
[root@CHESX01:~] esxcli network vm list World ID Name Num Ports Networks ——– ———— ——— ——– 71873692 CHADM3 1 VM Network 62291014 CHEXC19 1 VM Network < Here is our servers World ID 2107658 VDIVCS1 1 VM Network 2105346 CHVCA01_8.0 1 VM Network |
|
Now we need the “port ID or Number” and the “vSwitch” from the world for those two diagnose commands:
esxcli network vm port list –world-id 62291014 |
|
Port ID: 67108926 vSwitch: vSwitch0 Portgroup: VM Network DVPort ID: MAC Address: 00:50:56:82:80:8e IP Address: 0.0.0.0 Team Uplink: vmnic5 Uplink Port ID: 2214592525 |
|
Check for “running out of buffers” vsish -e get /net/portsets/vSwitch0/ports/67108926/vmxnet3/rxSummary | grep “running out of buffers” |
|
[root@CHESX01:~] vsish -e get /net/portsets/vSwitch0/ports/67108926/vmxnet3/rxSummary | grep “running out of buffers” running out of buffers:3795 |
|
Check the current status of the buffers just right now vsish -e get /net/portsets/vSwitch0/ports/67108926/vmxnet3/rxSummary | grep “1st ring” Because we see “# of times the 1st ring is full:0” we know that CURRENTLY the ESX host does NOT have the probleme just now. We would have to trigger the problem with as example a large ROBOCOPY job as mentioned in the VMWARE KB or running the backup of the server as example with VEEAM. |
|
[root@CHESX01:~] vsish -e get /net/portsets/vSwitch0/ports/67108926/vmxnet3/rxSummary | grep “1st ring” 1st ring size:1024 # of times the 1st ring is full:0 |
|
vsish -e get /net/portsets/vSwitch0/ports/67108926/vmxnet3/rxSummary |
|
[root@CHESX01:~] vsish -e get /net/portsets/vSwitch0/ports/67108926/vmxnet3/rxSummary stats of a vmxnet3 vNIC rx queue { LRO pkts rx ok:236973 LRO bytes rx ok:562847278 pkts rx ok:148393321 bytes rx ok:133252361827 unicast pkts rx ok:132478320 unicast bytes rx ok:131960544997 multicast pkts rx ok:648345 multicast bytes rx ok:90478346 broadcast pkts rx ok:15266656 broadcast bytes rx ok:1201338484 running out of buffers:3795 pkts receive error:0 1st ring size:1024 2nd ring size:512 # of times the 1st ring is full:0 # of times the 2nd ring is full:0 fail to map a rx buffer:0 request to page in a buffer:0 # of times rx queue is stopped:0 failed when copying into the guest buffer:0 # of pkts dropped due to large hdrs:0 # of pkts dropped due to max number of SG limits:0 pkts rx via data ring ok:0 bytes rx via data ring ok:0 Whether rx burst queuing is enabled:0 current backend burst queue length:0 maximum backend burst queue length so far:0 aggregate number of times packets are requeued:0 aggregate number of times packets are dropped by PktAgingList:0 # of pkts dropped due to large inner (encap) hdrs:0 number of times packets are dropped by burst queue:0 number of times packets are dropped by rx try lock queueing:0 number of packets delivered by burst queue:0 number of packets dropped by packet steering:0 number of memory region lookup pass in Rx.:0 number of packets dropped due to pkt length exceeds vNic mtu:0 number of packets dropped due to pkt truncation:0 amount of memory regions mapped for the vnic:0 total amount of memory regions registered for all vnics on the host:0 |
|
Here is how you could MONITOR the interfaces while you FORCE traffic |
|
watch -n 5 ‘vsish -e get /net/portsets/vSwitch0/ports/67108926/vmxnet3/rxSummary | grep -E “buffers|ring|drop|error”‘ |
esxcli network nic stats get -n vmnic5 |
||
|
NIC statistics for vmnic5 Packets received: 52885691658 Packets sent: 54841171082 Bytes received: 59251558579813 Bytes sent: 69665346225302 Receive packets dropped: 0 Transmit packets dropped: 0 Multicast packets received: 87039340 Broadcast packets received: 92076927 Multicast packets sent: 12550290 Broadcast packets sent: 113141479 Total receive errors: 1 Receive length errors: 1 Receive over errors: 0 Receive CRC errors: 0 Receive frame errors: 0 Receive FIFO errors: 0 Receive missed errors: 1785 Total transmit errors: 0 Transmit aborted errors: 0 Transmit carrier errors: 0 Transmit FIFO errors: 0 Transmit heartbeat errors: 0 Transmit window errors: 0 |
Regarding the Receive missed errors: 1785 these are minor compared to the Packets received: 52885691658 and Packets sent: 54841171082 so THAT side of the ESX seems fine. The server had an uptime of 412 days so this is ok for us.
Also check out on how to use esxtop and “n” option:
Packet loss older NIC VMWARE 1.9.11.0 on ESXi 8.0.2 – www.butsch.ch
https://www.butsch.ch/post/packet-loss-older-nic-vmware-1-9-11-0-on-esxi-8-0-2/
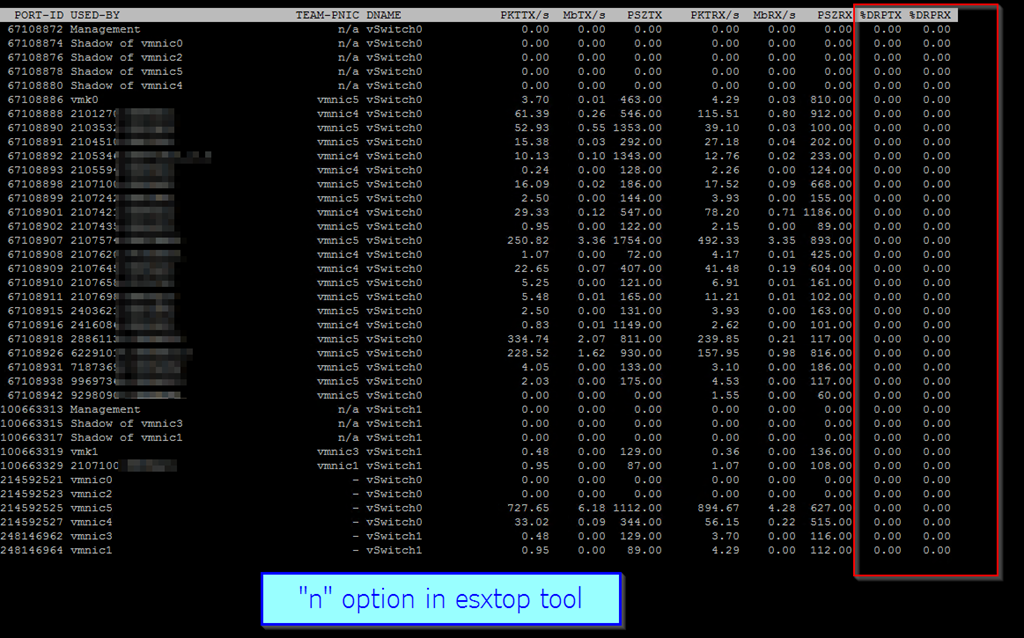
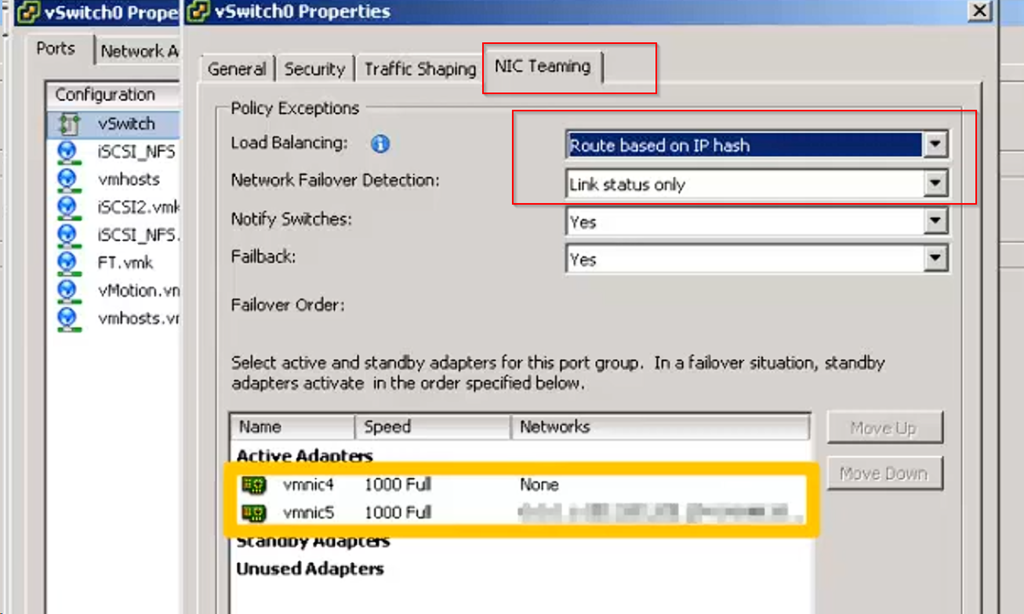
Is the source of the problem outside of the ESX and your Exchange Server? Ask network team about NIC teaming.
On ESX side If you have redundant Load Balancing on your NIC (NIC teaming) you may have to check out following or change to failover mode temporary.
This article provides information on the concepts, limitations, and some sample configurations of link aggregation, NIC Teaming, Link Aggregation Control Protocol (LACP), and EtherChannel connectivity between ESXi and Physical Network Switches, particularly for Cisco and HP.
https://knowledge.broadcom.com/external/article/324490/example-configuration-of-lacp-on-vmware.html
https://knowledge.broadcom.com/external/article/324555/host-requirements-for-link-aggregation-e.html
https://youtu.be/BZgBf4mL6fk?si=B-yUD_P7yOTrt5mi
Sample with HP Switches and ESX:
HP EtherChannel sample configuration
This configuration is specific to HP switches:
- HP switches support only two modes of LACP:
- ACTIVE
- PASSIVE
Note: LACP is only supported in vSphere with vSphere Distributed Switches.
- ACTIVE
- Set the HP switch port mode to TRUNK to accomplish static link aggregation with ESXi.
- TRUNK Mode of HP switch ports is the only supported aggregation method compatible with ESXi NIC teaming mode IP hash.
To configure a static port channel in an HP switch using ports 10, 11, 12, and 13, run this command:conftrunk 10-13 Trk1 Trunk
To verify the port channel, run this command:show trunkLoad BalancingPort | Name Type | Group Type---- + --------- + ----- -----10 | 100/1000T | Trk1 Trunk11 | 100/1000T | Trk1 Trunk12 | 100/1000T | Trk1 Trunk13 | 100/1000T | Trk1 Trunk
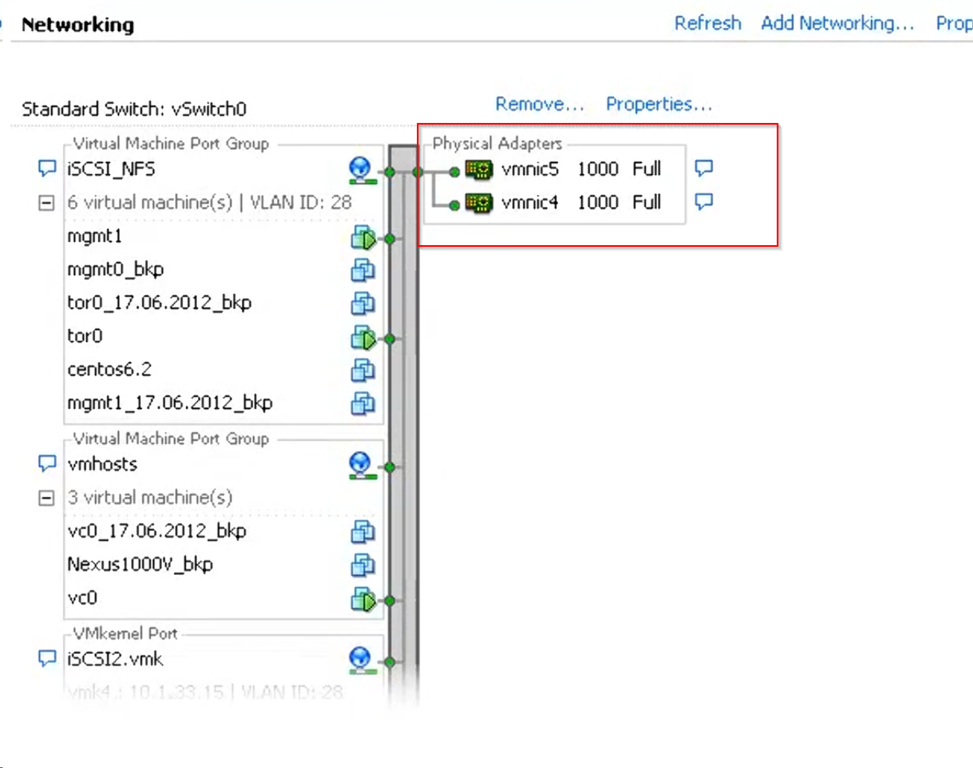
Settings which to check and maybe change TOGETHER with the Switch side options