 Click on the Category button to get more articles regarding that product.
Not fixed date 06.11.2025 with 17.6.4 BUILD 24832109
W11 24H2 and 25H2 same behaviour. Started 4-5 months ago. VMWARE Pro Update did not resolve.
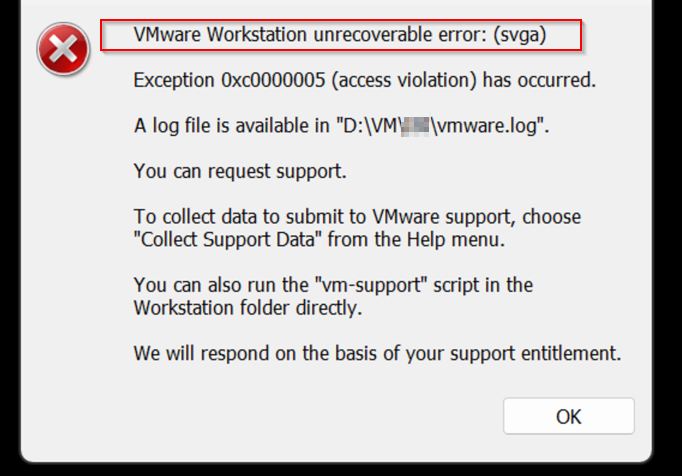
What happens
You have VMWARE Workstation PRO running a machine open
When you open a NEW EDGE Browser suddenly the W11 freezes and hangs for a few ticks then comes back.
After that the VMWARE shows a blank white screen. You can’t Turn off the VM with VM commands and sometimes you have to kill process or reboot
Problem
On Windows 11 24H2 or 25H2, opening Microsoft Edge while a VMware Workstation VM is running can cause a short system freeze. After that, VMware Workstation shows a white screen and the VM becomes unresponsive.
Cause
A conflict between Edge’s hardware acceleration (Chromium GPU rendering) and VMware Workstation’s 3D acceleration (DirectX / WDDM) triggers a GPU context reset. This began after recent Windows 11 graphics stack updates.
Solutions pathway:
1. Disable Hardware Acceleration in Edge
Open Edge → Settings → System and Performance


Disable Use hardware acceleration when available
Restart Edge.
2. Disable 3D Acceleration in VMware
In VMware Workstation, select the VM → Edit virtual machine settings → Display
Uncheck Accelerate 3D graphics

Start the VM again.
3. Change VMware Graphics Engine Mode
Edit → Preferences → Display
Switch hardware acceleration mode from Auto to another setting and test.
Update to VMware Workstation 17.5.2 or newer if available. > Did not solve
4. Update GPU Drivers
Install the latest graphics driver directly from the GPU vendor (NVIDIA, AMD, Intel). Reboot after installation.
This never solved it for us ;-(

5. Turn Off Edge “Startup Boost”
Edge → Settings → System and Performance
Disable Startup boost.
6. Optional: Force OpenGL Renderer in VMware
Edit
%AppData%\VMware\preferences.ini
Add:
mks.enableDX11Renderer = "FALSE"
mks.enableGLRenderer = "TRUE"
Save and restart VMware Workstation.
Result
After these adjustments, opening Edge no longer freezes the host or turns VMware Workstation windows white. The conflict between Edge and VMware’s GPU pipelines is eliminated.Problem
Evidence of error:

| System Event ID 153 |
| The description for Event ID 153 from source nvlddmkm cannot be found. Either the component that raises this event is not installed on your local computer or the installation is corrupted. You can install or repair the component on the local computer.
If the event originated on another computer, the display information had to be saved with the event. The following information was included with the event: \Device\Video1 The message resource is present but the message was not found in the message table |
TDR is Windows detecting that the GPU stopped responding and tried to recover.
\Device\Video1is the GPU device that failed.Restarting TDR occurred on GPUID:100means the GPU driver crashed briefly and was restarted by Windows.
Analyse of some crash dump: C:\Windows\LiveKernelReports\WATCHDOG-20251105-0847.dmp
0: kd> !analyze -v
Loading Kernel Symbols
...............................................................
................................................................
................................................................
.................................
Loading User Symbols

Loading unloaded module list
...............
*******************************************************************************
*                                                                             *
*                        Bugcheck Analysis                                    *
*                                                                             *
*******************************************************************************

VIDEO_ENGINE_TIMEOUT_DETECTED (141)
One of the display engines failed to respond in timely fashion.
(This code can never be used for a real BugCheck; it is used to identify live dumps.)
Arguments:
Arg1: ffff8081794f1010, Optional pointer to internal TDR recovery context (TDR_RECOVERY_CONTEXT).
Arg2: fffff8015d704580, The pointer into responsible device driver module (e.g. owner tag).
Arg3: 0000000000000000, The secondary driver specific bucketing key.
Arg4: ffff80816cd680c0, Optional internal context dependent data.

Debugging Details:
------------------

Unable to load image \SystemRoot\System32\DriverStore\FileRepository\nv_dispi.inf_amd64_fe5f369669db2f36\nvlddmkm.sys, Win32 error 0n2
Page 801891 not present in the dump file. Type ".hh dbgerr004" for details

KEY_VALUES_STRING: 1

    Key  : Analysis.CPU.mSec
    Value: 2484

    Key  : Analysis.Elapsed.mSec
    Value: 5927

    Key  : Analysis.IO.Other.Mb
    Value: 0

    Key  : Analysis.IO.Read.Mb
    Value: 1

    Key  : Analysis.IO.Write.Mb
    Value: 34

    Key  : Analysis.Init.CPU.mSec
    Value: 1343

    Key  : Analysis.Init.Elapsed.mSec
    Value: 372063

    Key  : Analysis.Memory.CommitPeak.Mb
    Value: 110

    Key  : Analysis.Version.DbgEng
    Value: 10.0.29482.1003

    Key  : Analysis.Version.Description
    Value: 10.2509.29.03 amd64fre

    Key  : Analysis.Version.Ext
    Value: 1.2509.29.3

    Key  : Bugcheck.Code.LegacyAPI
    Value: 0x141

    Key  : Bugcheck.Code.TargetModel
    Value: 0x141

    Key  : Dump.Attributes.AsUlong
    Value: 0x10

    Key  : Failure.Bucket
    Value: LKD_0x141_IMAGE_nvlddmkm.sys

    Key  : Failure.Exception.IP.Address
    Value: 0xfffff8015d704580

    Key  : Failure.Exception.IP.Module
    Value: nvlddmkm

    Key  : Failure.Exception.IP.Offset
    Value: 0x1a44580

    Key  : Failure.Hash
    Value: {341dd0b3-9ebd-47a8-9de8-23f4b00fabbc}

    Key  : Faulting.IP.Type
    Value: Paged

    Key  : Hypervisor.Enlightenments.Value
    Value: 0

    Key  : Hypervisor.Enlightenments.ValueHex
    Value: 0x0

    Key  : Hypervisor.Flags.AnyHypervisorPresent
    Value: 0

    Key  : Hypervisor.Flags.ApicEnlightened
    Value: 0

    Key  : Hypervisor.Flags.ApicVirtualizationAvailable
    Value: 0

    Key  : Hypervisor.Flags.AsyncMemoryHint
    Value: 0

    Key  : Hypervisor.Flags.CoreSchedulerRequested
    Value: 0

    Key  : Hypervisor.Flags.CpuManager
    Value: 0

    Key  : Hypervisor.Flags.DeprecateAutoEoi
    Value: 0

    Key  : Hypervisor.Flags.DynamicCpuDisabled
    Value: 0

    Key  : Hypervisor.Flags.Epf
    Value: 0

    Key  : Hypervisor.Flags.ExtendedProcessorMasks
    Value: 0

    Key  : Hypervisor.Flags.HardwareMbecAvailable
    Value: 1

    Key  : Hypervisor.Flags.MaxBankNumber
    Value: 0

    Key  : Hypervisor.Flags.MemoryZeroingControl
    Value: 0

    Key  : Hypervisor.Flags.NoExtendedRangeFlush
    Value: 0

    Key  : Hypervisor.Flags.NoNonArchCoreSharing
    Value: 0

    Key  : Hypervisor.Flags.Phase0InitDone
    Value: 0

    Key  : Hypervisor.Flags.PowerSchedulerQos
    Value: 0

    Key  : Hypervisor.Flags.RootScheduler
    Value: 0

    Key  : Hypervisor.Flags.SynicAvailable
    Value: 0

    Key  : Hypervisor.Flags.UseQpcBias
    Value: 0

    Key  : Hypervisor.Flags.Value
    Value: 131072

    Key  : Hypervisor.Flags.ValueHex
    Value: 0x20000

    Key  : Hypervisor.Flags.VpAssistPage
    Value: 0

    Key  : Hypervisor.Flags.VsmAvailable
    Value: 0

    Key  : Hypervisor.RootFlags.AccessStats
    Value: 0

    Key  : Hypervisor.RootFlags.CrashdumpEnlightened
    Value: 0

    Key  : Hypervisor.RootFlags.CreateVirtualProcessor
    Value: 0

    Key  : Hypervisor.RootFlags.DisableHyperthreading
    Value: 0

    Key  : Hypervisor.RootFlags.HostTimelineSync
    Value: 0

    Key  : Hypervisor.RootFlags.HypervisorDebuggingEnabled
    Value: 0

    Key  : Hypervisor.RootFlags.IsHyperV
    Value: 0

    Key  : Hypervisor.RootFlags.LivedumpEnlightened
    Value: 0

    Key  : Hypervisor.RootFlags.MapDeviceInterrupt
    Value: 0

    Key  : Hypervisor.RootFlags.MceEnlightened
    Value: 0

    Key  : Hypervisor.RootFlags.Nested
    Value: 0

    Key  : Hypervisor.RootFlags.StartLogicalProcessor
    Value: 0

    Key  : Hypervisor.RootFlags.Value
    Value: 0

    Key  : Hypervisor.RootFlags.ValueHex
    Value: 0x0

    Key  : SecureKernel.HalpHvciEnabled
    Value: 0

    Key  : WER.OS.Branch
    Value: ge_release

    Key  : WER.OS.Version
    Value: 10.0.26100.1

    Key  : WER.System.BIOSRevision
    Value: 18.0.0.0


BUGCHECK_CODE:  141

BUGCHECK_P1: ffff8081794f1010

BUGCHECK_P2: fffff8015d704580

BUGCHECK_P3: 0

BUGCHECK_P4: ffff80816cd680c0

FILE_IN_CAB:  WATCHDOG-20251105-0847.dmp

DUMP_FILE_ATTRIBUTES: 0x10
  Live Generated Dump

FAULTING_THREAD:  ffff808154461080

TAG_NOT_DEFINED_202b:  *** Unknown TAG in analysis list 202b


VIDEO_TDR_CONTEXT: dt dxgkrnl!_TDR_RECOVERY_CONTEXT ffff8081794f1010
Symbol dxgkrnl!_TDR_RECOVERY_CONTEXT not found.

PROCESS_OBJECT: ffff80816cd680c0

PROCESS_NAME:  msedge.exe

IP_IN_PAGED_CODE:
nvlddmkm+1a44580
fffff801`5d704580 488b05d9298aff  mov     rax,qword ptr [nvlddmkm+0x12e6f60 (fffff801`5cfa6f60)]

STACK_TEXT:
ffff9104`992efe70 fffff801`c1f94c65     : 00000000`00000000 00000000`00000000 ffff9104`992eff40 ffff8081`54461080 : nt!IopLiveDumpCollectPages+0xd9
ffff9104`992efec0 fffff801`c2550ccf     : 00000000`00000000 ffff8081`54461080 ffff9104`992eff40 00000000`00000002 : nt!IopLiveDumpEndMirroringCallback+0x55
ffff9104`992efef0 fffff801`c1f9428a     : 00000000`00000000 00000000`00000000 ffff8081`7aa80010 ffff9104`992f03b8 : nt!MmDuplicateMemory+0x2e7
ffff9104`992eff80 fffff801`c1f9436c     : 00000000`00000000 fffff801`c209f910 00000000`00000000 00000000`00000000 : nt!IopLiveDumpCapture+0x86
ffff9104`992effe0 fffff801`c1ee0e88     : ffff8081`7aa80010 ffff8081`7aa80010 ffff8081`7aa804c0 00000000`00000000 : nt!IopLiveDumpCaptureMemoryPages+0x50
ffff9104`992f0120 fffff801`c249259d     : 00000000`00000000 ffff8081`5a273300 00000000`00000038 ffffe38a`e76593c0 : nt!IoCaptureLiveDump+0x428
ffff9104`992f0350 fffff801`c20fac98     : 00000000`00000000 00000000`00000000 00000000`00000000 00000000`00000000 : nt!DbgkpWerCaptureLiveFullDump+0x181
ffff9104`992f03b0 fffff801`c24a1e6a     : ffffe38a`00000003 00000000`00000000 00000000`00000000 fffff801`5399190c : nt!DbgkpWerProcessPolicyResult+0x30
ffff9104`992f03e0 fffff801`c24a1c69     : 00000000`00000001 ffff9104`992f05c0 ffff8081`794f1010 ffff8081`68203090 : nt!DbgkWerCaptureLiveKernelDump2+0x1ea
ffff9104`992f0440 fffff801`53ceca99     : ffffe38a`e72f3900 ffffe38a`e72f3900 ffffe38a`f11267bf ffff8081`59e1d000 : nt!DbgkWerCaptureLiveKernelDump+0x69
ffff9104`992f04c0 fffff801`668a829a     : 00000000`00000006 00000000`00000006 ffff8081`59ef2000 ffff8081`59e1f000 : dxgkrnl!TdrCollectDbgInfoStage1+0xd29
ffff9104`992f0680 fffff801`669061e6     : ffff8081`59ef2000 ffff8081`59ef2000 ffff8081`59e1f000 00000000`00000000 : dxgmms2!VidSchiResetEngine+0x36e
ffff9104`992f0870 fffff801`6690ebf6     : ffff9104`00000000 ffff8081`59e1f000 ffff9104`992f09f9 00000000`00000000 : dxgmms2!VidSchiResetEngines+0xea
ffff9104`992f08c0 fffff801`66883c4f     : ffff8081`59e1f000 00000000`00000000 ffff9104`992f09f9 00000000`0000cf68 : dxgmms2!VidSchiCheckHwProgress+0x316
ffff9104`992f0950 fffff801`6690f5b2     : ffff8081`59e1f000 ffff8081`5a5df010 ffff8081`6cd0c520 ffff8081`775f06e0 : dxgmms2!VidSchiScheduleCommandToRun+0x5f
ffff9104`992f0a60 fffff801`669063d1     : ffff8081`59e1f500 ffff8081`59e1f000 fffff801`669062f0 ffff8081`59e1f000 : dxgmms2!VidSchiRun_PriorityTable+0x42
ffff9104`992f0ab0 fffff801`c1e81afa     : ffff8081`54461080 fffff801`00000001 ffff9280`4ee69180 024fa4ef`bd9bbfff : dxgmms2!VidSchiWorkerThread+0xe1
ffff9104`992f0af0 fffff801`c209ef84     : ffff9280`4ee69180 ffff8081`54461080 fffff801`c1e81aa0 00690074`00630065 : nt!PspSystemThreadStartup+0x5a
ffff9104`992f0b40 00000000`00000000     : ffff9104`992f1000 ffff9104`992ea000 00000000`00000000 00000000`00000000 : nt!KiStartSystemThread+0x34


SYMBOL_NAME:  nvlddmkm+1a44580

MODULE_NAME: nvlddmkm

IMAGE_NAME:  nvlddmkm.sys

STACK_COMMAND: .process /r /p 0xffff80813a6b9040; .thread 0xffff808154461080 ; kb

FAILURE_BUCKET_ID:  LKD_0x141_IMAGE_nvlddmkm.sys

OS_VERSION:  10.0.26100.1

BUILDLAB_STR:  ge_release

OSPLATFORM_TYPE:  x64

OSNAME:  Windows 10

FAILURE_ID_HASH:  {341dd0b3-9ebd-47a8-9de8-23f4b00fabbc}

Followup:     MachineOwner
---------
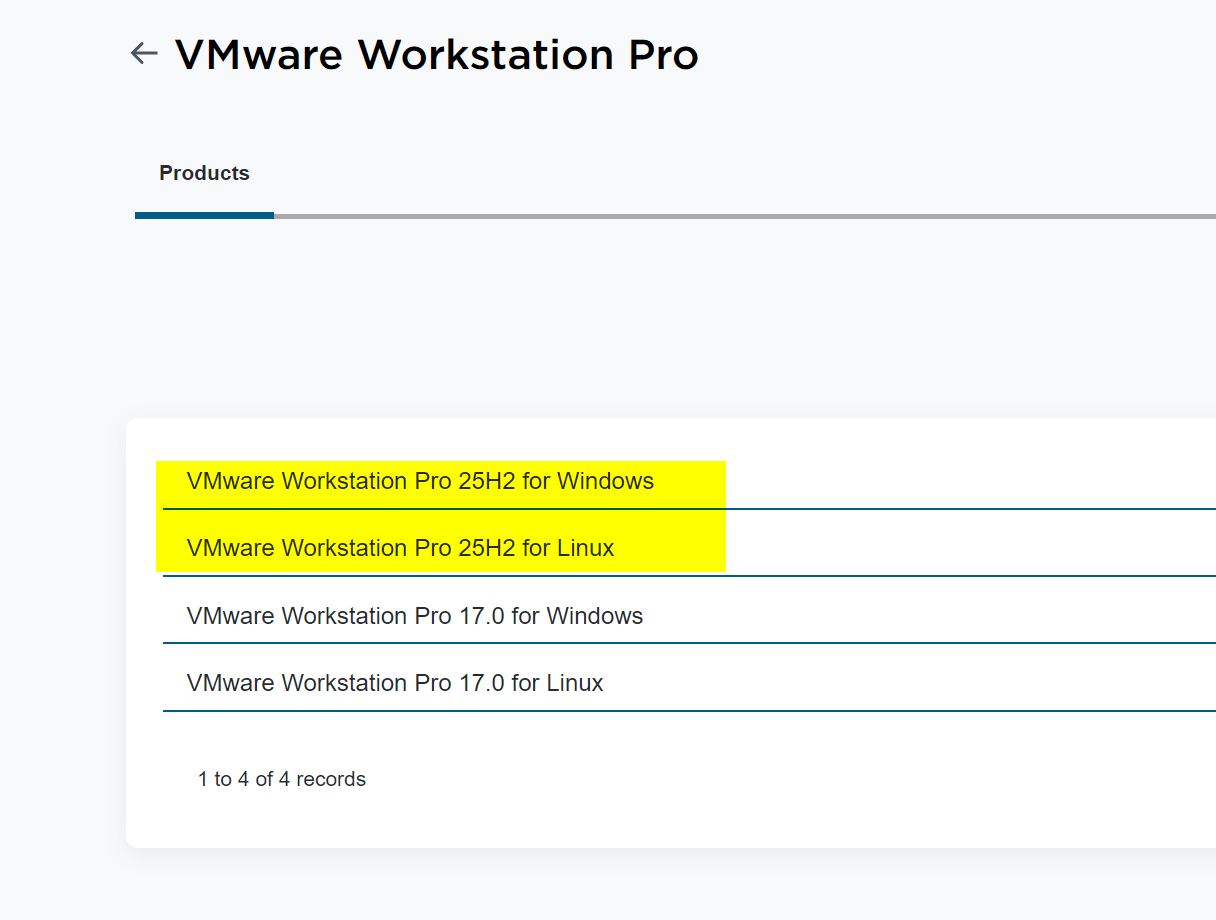
16.12.2025 Broadcom released a new version of VMWARE Workstation
https://knowledge.broadcom.com/external/article/368734
At least with LINUX there is something about 3D Settings/Acceleration in the Release Notes for Workstation Pro 25H2
It did not help same issue this morning 17.12.2025
Logfile of crash with latest PRO 25H2 Version on W11 25H2 latest 12-2025 patches installed
2025-12-14T09:04:28.551Z -INFO vmware-vmx.exe 22116 [ws@4413 threadName="vmx"] Log for VMware Workstation pid=22116 version=25.0.0 build=24995812 option=Release
2025-12-14T09:04:28.551Z -INFO vmware-vmx.exe 22116 [ws@4413 threadName="vmx"] The host is x86_64.
2025-12-14T09:04:28.551Z -INFO vmware-vmx.exe 22116 [ws@4413 threadName="vmx"] Host codepage=windows-1252 encoding=windows-1252
2025-12-14T09:04:28.551Z -INFO vmware-vmx.exe 22116 [ws@4413 threadName="vmx"] Host is Windows 11 Pro, 64-bit (Build 26200.7462)
2025-12-14T09:04:28.551Z -INFO vmware-vmx.exe 22116 [ws@4413 threadName="vmx"] Host offset from UTC is -01:00.
2025-12-14T09:04:28.520Z -INFO vmware-vmx.exe 22116 [ws@4413 threadName="vmx"] VTHREAD 19612 "vmx"
2025-12-14T09:04:28.524Z -INFO vmware-vmx.exe 22116 [ws@4413 threadName="vmx"] DictionaryLoad: Cannot open file "C:\ProgramData\VMware\vCenterServer\cfg\vsphereFeatures\vsphereFeatures.cfg": The system cannot find the path specified.
2025-12-14T09:04:28.524Z -INFO vmware-vmx.exe 22116 [ws@4413 threadName="vmx"] [msg.dictionary.load.openFailed] Cannot open file "C:\ProgramData\VMware\vCenterServer\cfg\vsphereFeatures\vsphereFeatures.cfg": The system cannot find the path specified.
2025-12-14T09:04:28.524Z -INFO vmware-vmx.exe 22116 [ws@4413 threadName="vmx"] FeatureStateLib: Error while loading feature config file: C:\ProgramData\VMware\vCenterServer\cfg\vsphereFeatures\vsphereFeatures.cfg, using default feature state values.
2025-12-14T09:04:28.525Z -INFO vmware-vmx.exe 22116 [ws@4413 threadName="vmx"] DictionaryLoad: Cannot open file "C:\ProgramData\VMware\vCenterServer\cfg\vsphereFeatures\techPreview.cfg": The system cannot find the path specified.
2025-12-14T09:04:28.525Z -INFO vmware-vmx.exe 22116 [ws@4413 threadName="vmx"] [msg.dictionary.load.openFailed] Cannot open file "C:\ProgramData\VMware\vCenterServer\cfg\vsphereFeatures\techPreview.cfg": The system cannot find the path specified.
2025-12-14T09:04:28.525Z -INFO vmware-vmx.exe 22116 [ws@4413 threadName="vmx"] FeatureStateLib: Error while loading tech preview config file: C:\ProgramData\VMware\vCenterServer\cfg\vsphereFeatures\techPreview.cfg, using default (disabled) for all Tech Preview features.
2025-12-14T09:04:28.528Z -INFO vmware-vmx.exe 22116 [ws@4413 threadName="vmx"] LOCALE windows-1252 -> NULL User=807 System=809
2025-12-14T09:04:28.528Z -INFO vmware-vmx.exe 22116 [ws@4413 threadName="vmx"] Msg_SetLocaleEx: HostLocale=windows-1252 UserLocale=NULL
2025-12-14T09:04:28.534Z -INFO vmware-vmx.exe 22116 [ws@4413 threadName="vmx"] DictionaryLoad: Cannot open file "C:\Users\mb\AppData\Roaming\VMware\config.ini": The system cannot find the file specified.
2025-12-14T09:04:28.534Z -INFO vmware-vmx.exe 22116 [ws@4413 threadName="vmx"] Msg_Reset:
2025-12-14T09:04:28.534Z -INFO vmware-vmx.exe 22116 [ws@4413 threadName="vmx"] [msg.dictionary.load.openFailed] Cannot open file "C:\Users\mb\AppData\Roaming\VMware\config.ini": The system cannot find the file specified.
2025-12-14T09:04:28.534Z -INFO vmware-vmx.exe 22116 [ws@4413 threadName="vmx"] ----------------------------------------
2025-12-14T09:04:28.534Z -INFO vmware-vmx.exe 22116 [ws@4413 threadName="vmx"] ConfigDB: Failed to load C:\Users\mb\AppData\Roaming\VMware\config.ini
2025-12-14T09:04:28.534Z -INFO vmware-vmx.exe 22116 [ws@4413 threadName="vmx"] OBJLIB-LIB: Objlib initialized.
2025-12-14T09:04:28.539Z -INFO vmware-vmx.exe 22116 [ws@4413 threadName="vmx"] DictionaryLoad: Cannot open file "C:\Users\mb\AppData\Roaming\VMware\config.ini": The system cannot find the file specified.
2025-12-14T09:04:28.539Z -INFO vmware-vmx.exe 22116 [ws@4413 threadName="vmx"] [msg.dictionary.load.openFailed] Cannot open file "C:\Users\mb\AppData\Roaming\VMware\config.ini": The system cannot find the file specified.
2025-12-14T09:04:28.539Z -INFO vmware-vmx.exe 22116 [ws@4413 threadName="vmx"] PREF Optional preferences file not found at C:\Users\mb\AppData\Roaming\VMware\config.ini. Using default values.
2025-12-14T09:04:28.545Z -INFO vmware-vmx.exe 22116 [ws@4413 threadName="vmx"] lib/ssl: OpenSSL using default provider
2025-12-14T09:04:28.546Z -INFO vmware-vmx.exe 22116 [ws@4413 threadName="vmx"] lib/ssl: Client usage
2025-12-14T09:04:28.546Z -INFO vmware-vmx.exe 22116 [ws@4413 threadName="vmx"] lib/ssl: protocol list tls1.2,tls1.3
2025-12-14T09:04:28.546Z -INFO vmware-vmx.exe 22116 [ws@4413 threadName="vmx"] lib/ssl: protocol min 0x303 max 0x304
2025-12-14T09:04:28.546Z -INFO vmware-vmx.exe 22116 [ws@4413 threadName="vmx"] lib/ssl: protocol list tls1.2,tls1.3 (openssl flags 0x16000000)
2025-12-14T09:04:28.546Z -INFO vmware-vmx.exe 22116 [ws@4413 threadName="vmx"] lib/ssl: cipher list ECDHE+AESGCM:RSA+AESGCM:ECDHE+AES:RSA+AES
2025-12-14T09:04:28.546Z -INFO vmware-vmx.exe 22116 [ws@4413 threadName="vmx"] lib/ssl: cipher suites TLS_AES_128_GCM_SHA256:TLS_AES_256_GCM_SHA384
2025-12-14T09:04:28.546Z -INFO vmware-vmx.exe 22116 [ws@4413 threadName="vmx"] lib/ssl: curves list prime256v1:secp384r1:secp521r1
2025-12-14T09:04:28.546Z -INFO vmware-vmx.exe 22116 [ws@4413 threadName="vmx"] lib/ssl: Server usage
2025-12-14T09:04:28.546Z -INFO vmware-vmx.exe 22116 [ws@4413 threadName="vmx"] lib/ssl: protocol list tls1.2,tls1.3
2025-12-14T09:04:28.546Z -INFO vmware-vmx.exe 22116 [ws@4413 threadName="vmx"] lib/ssl: protocol min 0x303 max 0x304
2025-12-14T09:04:28.546Z -INFO vmware-vmx.exe 22116 [ws@4413 threadName="vmx"] lib/ssl: protocol list tls1.2,tls1.3 (openssl flags 0x16000000)
2025-12-14T09:04:28.546Z -INFO vmware-vmx.exe 22116 [ws@4413 threadName="vmx"] lib/ssl: cipher list ECDHE+AESGCM:RSA+AESGCM:ECDHE+AES:RSA+AES
2025-12-14T09:04:28.546Z -INFO vmware-vmx.exe 22116 [ws@4413 threadName="vmx"] lib/ssl: cipher suites TLS_AES_128_GCM_SHA256:TLS_AES_256_GCM_SHA384
2025-12-14T09:04:28.546Z -INFO vmware-vmx.exe 22116 [ws@4413 threadName="vmx"] lib/ssl: curves list prime256v1:secp384r1:secp521r1
2025-12-14T09:04:28.555Z -INFO vmware-vmx.exe 22116 [ws@4413 threadName="vmx"] Hostname=W11
2025-12-14T09:04:28.583Z -INFO vmware-vmx.exe 22116 [ws@4413 threadName="vmx"] System uptime 5579416076 us
2025-12-14T09:04:28.583Z -INFO vmware-vmx.exe 22116 [ws@4413 threadName="vmx"] Command line: "C:\Program Files (x86)\VMware\VMware Workstation\x64\vmware-vmx.exe" "-T" "querytoken" "-s" "vmx.stdio.keep=TRUE" "-#" "product=1;name=VMware Workstation;version=25.0.0;buildnumber=24995812;licensename=VMware Workstation;licenseversion=17.0;" "-@" "pipe=\\.\pipe\vmx5be561833fd2cd84;msgs=ui" "D:\VM\mb\mb.vmx"
2025-12-14T09:04:28.583Z -INFO vmware-vmx.exe 22116 [ws@4413 threadName="vmx"] Msg_SetLocaleEx: HostLocale=windows-1252 UserLocale=NULL
2025-12-14T09:04:28.604Z -INFO vmware-vmx.exe 22116 [ws@4413 threadName="vmx"] WQPoolAllocPoll : pollIx = 1, signalHandle = 808
2025-12-14T09:04:28.604Z -INFO vmware-vmx.exe 22116 [ws@4413 threadName="vmx"] WQPoolAllocPoll : pollIx = 2, signalHandle = 800
2025-12-14T09:04:28.604Z -INFO vmware-vmx.exe 22116 [ws@4413 threadName="vmx"] VigorTransport listening on fd 884
2025-12-14T09:04:28.604Z -INFO vmware-vmx.exe 22116 [ws@4413 threadName="vmx"] Vigor_Init 1
2025-12-14T09:04:28.605Z -INFO vmware-vmx.exe 22116 [ws@4413 threadName="vmx"] Connecting 'ui' to pipe '\\.\pipe\vmx5be561833fd2cd84' with user '(null)'
2025-12-14T09:04:28.605Z -INFO vmware-vmx.exe 22116 [ws@4413 threadName="vmx"] VMXVmdb: Local connection timeout: 60000 ms.
2025-12-14T09:04:28.709Z -INFO vmware-vmx.exe 22116 [ws@4413 threadName="vmx"] VmdbAddConnection: cnxPath=/db/connection/#1/, cnxIx=1
2025-12-14T09:04:28.709Z -INFO vmware-vmx.exe 22116 [ws@4413 threadName="vmx"] Vix: [mainDispatch.c:490]: VMAutomation: Initializing VMAutomation.
2025-12-14T09:04:28.710Z -INFO vmware-vmx.exe 22116 [ws@4413 threadName="vmx"] Vix: [mainDispatch.c:742]: VMAutomationOpenListenerSocket() listening
2025-12-14T09:04:28.714Z -INFO vmware-vmx.exe 22116 [ws@4413 threadName="vmx"] Vix: [mainDispatch.c:4172]: VMAutomation_ReportPowerOpFinished: statevar=0, newAppState=1870, success=1 additionalError=0
2025-12-14T09:04:28.714Z -INFO vmware-vmx.exe 22116 [ws@4413 threadName="vmx"] Transitioned vmx/execState/val to poweredOff
2025-12-14T09:04:28.714Z -INFO vmware-vmx.exe 22116 [ws@4413 threadName="vmx"] Vix: [mainDispatch.c:4172]: VMAutomation_ReportPowerOpFinished: statevar=1, newAppState=1873, success=1 additionalError=0
2025-12-14T09:04:28.714Z -INFO vmware-vmx.exe 22116 [ws@4413 threadName="vmx"] Vix: [mainDispatch.c:4172]: VMAutomation_ReportPowerOpFinished: statevar=2, newAppState=1877, success=1 additionalError=0
2025-12-14T09:04:28.714Z -INFO vmware-vmx.exe 22116 [ws@4413 threadName="vmx"] Vix: [mainDispatch.c:4172]: VMAutomation_ReportPowerOpFinished: statevar=3, newAppState=1881, success=1 additionalError=0
2025-12-14T09:04:28.855Z -INFO vmware-vmx.exe 22116 [ws@4413 threadName="vmx"] IOPL_VBSRunning: VBS is set to 0
2025-12-14T09:04:28.856Z -INFO vmware-vmx.exe 22116 [ws@4413 threadName="vmx"] IOCTL_VMX86_SET_MEMORY_PARAMS already set
2025-12-14T09:04:57.129Z -INFO vmware-vmx.exe 22116 [ws@4413 threadName="vmx"] hostCPUID vendor: GenuineIntel
2025-12-14T09:04:57.129Z -INFO vmware-vmx.exe 22116 [ws@4413 threadName="vmx"] hostCPUID family: 0x6 model: 0x9e stepping: 0xa
2025-12-14T09:04:57.129Z -INFO vmware-vmx.exe 22116 [ws@4413 threadName="vmx"] hostCPUID codename: Coffee Lake-S/H
2025-12-14T09:04:57.129Z -INFO vmware-vmx.exe 22116 [ws@4413 threadName="vmx"] hostCPUID name: Intel(R) Core(TM) i7-8700 CPU @ 3.20GHz
2025-12-14T09:04:57.129Z -INFO vmware-vmx.exe 22116 [ws@4413 threadName="vmx"] hostCPUID level 00000000, 0: 0x00000016 0x756e6547 0x6c65746e 0x49656e69
2025-12-14T09:04:57.129Z -INFO vmware-vmx.exe 22116 [ws@4413 threadName="vmx"] hostCPUID level 00000001, 0: 0x000906ea 0x00100800 0x7ffafbff 0xbfebfbff
2025-12-14T09:04:57.129Z -INFO vmware-vmx.exe 22116 [ws@4413 threadName="vmx"] hostCPUID level 00000002, 0: 0x76036301 0x00f0b5ff 0x00000000 0x00c30000
2025-12-14T09:04:57.129Z -INFO vmware-vmx.exe 22116 [ws@4413 threadName="vmx"] hostCPUID level 00000003, 0: 0x00000000 0x00000000 0x00000000 0x00000000
2025-12-14T09:04:57.129Z -INFO vmware-vmx.exe 22116 [ws@4413 threadName="vmx"] hostCPUID level 00000004, 0: 0x1c004121 0x01c0003f 0x0000003f 0x00000000
2025-12-14T09:04:57.129Z -INFO vmware-vmx.exe 22116 [ws@4413 threadName="vmx"] hostCPUID level 00000004, 1: 0x1c004122 0x01c0003f 0x0000003f 0x00000000
2025-12-14T09:04:57.129Z -INFO vmware-vmx.exe 22116 [ws@4413 threadName="vmx"] hostCPUID level 00000004, 2: 0x1c004143 0x00c0003f 0x000003ff 0x00000000
2025-12-14T09:04:57.129Z -INFO vmware-vmx.exe 22116 [ws@4413 threadName="vmx"] hostCPUID level 00000004, 3: 0x1c03c163 0x03c0003f 0x00002fff 0x00000006
2025-12-14T09:04:57.129Z -INFO vmware-vmx.exe 22116 [ws@4413 threadName="vmx"] hostCPUID level 00000004, 4: 0x00000000 0x00000000 0x00000000 0x00000000
2025-12-14T09:04:57.129Z -INFO vmware-vmx.exe 22116 [ws@4413 threadName="vmx"] hostCPUID level 00000005, 0: 0x00000040 0x00000040 0x00000003 0x11142120
2025-12-14T09:04:57.129Z -INFO vmware-vmx.exe 22116 [ws@4413 threadName="vmx"] hostCPUID level 00000006, 0: 0x000027f7 0x00000002 0x00000009 0x00000000
2025-12-14T09:04:57.129Z -INFO vmware-vmx.exe 22116 [ws@4413 threadName="vmx"] hostCPUID level 00000007, 0: 0x00000000 0x029c6fbf 0x40000000 0xbc002e00
2025-12-14T09:04:57.129Z -INFO vmware-vmx.exe 22116 [ws@4413 threadName="vmx"] hostCPUID level 00000008, 0: 0x00000000 0x00000000 0x00000000 0x00000000
2025-12-14T09:04:57.129Z -INFO vmware-vmx.exe 22116 [ws@4413 threadName="vmx"] hostCPUID level 00000009, 0: 0x00000000 0x00000000 0x00000000 0x00000000
2025-12-14T09:04:57.129Z -INFO vmware-vmx.exe 22116 [ws@4413 threadName="vmx"] hostCPUID level 0000000a, 0: 0x07300404 0x00000000 0x00000000 0x00000603
2025-12-14T09:04:57.129Z -INFO vmware-vmx.exe 22116 [ws@4413 threadName="vmx"] hostCPUID level 0000000b, 0: 0x00000001 0x00000002 0x00000100 0x00000000
2025-12-14T09:04:57.129Z -INFO vmware-vmx.exe 22116 [ws@4413 threadName="vmx"] hostCPUID level 0000000b, 1: 0x00000004 0x0000000c 0x00000201 0x00000000
2025-12-14T09:04:57.129Z -INFO vmware-vmx.exe 22116 [ws@4413 threadName="vmx"] hostCPUID level 0000000b, 2: 0x00000000 0x00000000 0x00000002 0x00000000
2025-12-14T09:04:57.129Z -INFO vmware-vmx.exe 22116 [ws@4413 threadName="vmx"] hostCPUID level 0000000c, 0: 0x00000000 0x00000000 0x00000000 0x00000000
2025-12-14T09:04:57.129Z -INFO vmware-vmx.exe 22116 [ws@4413 threadName="vmx"] hostCPUID level 0000000d, 0: 0x0000001f 0x00000440 0x00000440 0x00000000
2025-12-14T09:04:57.129Z -INFO vmware-vmx.exe 22116 [ws@4413 threadName="vmx"] hostCPUID level 0000000d, 1: 0x0000000f 0x00000440 0x00000100 0x00000000
2025-12-14T09:04:57.129Z -INFO vmware-vmx.exe 22116 [ws@4413 threadName="vmx"] hostCPUID level 0000000d, 2: 0x00000100 0x00000240 0x00000000 0x00000000
2025-12-14T09:04:57.129Z -INFO vmware-vmx.exe 22116 [ws@4413 threadName="vmx"] hostCPUID level 0000000d, 3: 0x00000040 0x000003c0 0x00000000 0x00000000
2025-12-14T09:04:57.129Z -INFO vmware-vmx.exe 22116 [ws@4413 threadName="vmx"] hostCPUID level 0000000d, 4: 0x00000040 0x00000400 0x00000000 0x00000000
2025-12-14T09:04:57.129Z -INFO vmware-vmx.exe 22116 [ws@4413 threadName="vmx"] hostCPUID level 0000000d, 5: 0x00000000 0x00000000 0x00000000 0x00000000
2025-12-14T09:04:57.129Z -INFO vmware-vmx.exe 22116 [ws@4413 threadName="vmx"] hostCPUID level 0000000d, 6: 0x00000000 0x00000000 0x00000000 0x00000000
2025-12-14T09:04:57.129Z -INFO vmware-vmx.exe 22116 [ws@4413 threadName="vmx"] hostCPUID level 0000000d, 7: 0x00000000 0x00000000 0x00000000 0x00000000
2025-12-14T09:04:57.129Z -INFO vmware-vmx.exe 22116 [ws@4413 threadName="vmx"] hostCPUID level 0000000d, 8: 0x00000080 0x00000000 0x00000001 0x00000000
2025-12-14T09:04:57.129Z -INFO vmware-vmx.exe 22116 [ws@4413 threadName="vmx"] hostCPUID level 0000000e, 0: 0x00000000 0x00000000 0x00000000 0x00000000
2025-12-14T09:04:57.129Z -INFO vmware-vmx.exe 22116 [ws@4413 threadName="vmx"] hostCPUID level 0000000f, 0: 0x00000000 0x00000000 0x00000000 0x00000000
2025-12-14T09:04:57.129Z -INFO vmware-vmx.exe 22116 [ws@4413 threadName="vmx"] hostCPUID level 0000000f, 1: 0x00000000 0x00000000 0x00000000 0x00000000
2025-12-14T09:04:57.129Z -INFO vmware-vmx.exe 22116 [ws@4413 threadName="vmx"] hostCPUID level 00000010, 0: 0x00000000 0x00000000 0x00000000 0x00000000
2025-12-14T09:04:57.129Z -INFO vmware-vmx.exe 22116 [ws@4413 threadName="vmx"] hostCPUID level 00000010, 1: 0x00000000 0x00000000 0x00000000 0x00000000
2025-12-14T09:04:57.129Z -INFO vmware-vmx.exe 22116 [ws@4413 threadName="vmx"] hostCPUID level 00000010, 2: 0x00000000 0x00000000 0x00000000 0x00000000
2025-12-14T09:04:57.129Z -INFO vmware-vmx.exe 22116 [ws@4413 threadName="vmx"] hostCPUID level 00000010, 3: 0x00000000 0x00000000 0x00000000 0x00000000
2025-12-14T09:04:57.129Z -INFO vmware-vmx.exe 22116 [ws@4413 threadName="vmx"] hostCPUID level 00000011, 0: 0x00000000 0x00000000 0x00000000 0x00000000
2025-12-14T09:04:57.129Z -INFO vmware-vmx.exe 22116 [ws@4413 threadName="vmx"] hostCPUID level 00000012, 0: 0x00000000 0x00000000 0x00000000 0x00000000
2025-12-14T09:04:57.129Z -INFO vmware-vmx.exe 22116 [ws@4413 threadName="vmx"] hostCPUID level 00000012, 1: 0x00000000 0x00000000 0x00000000 0x00000000
2025-12-14T09:04:57.129Z -INFO vmware-vmx.exe 22116 [ws@4413 threadName="vmx"] hostCPUID level 00000012, 2: 0x00000000 0x00000000 0x00000000 0x00000000
2025-12-14T09:04:57.129Z -INFO vmware-vmx.exe 22116 [ws@4413 threadName="vmx"] hostCPUID level 00000012, 3: 0x00000000 0x00000000 0x00000000 0x00000000
2025-12-14T09:04:57.129Z -INFO vmware-vmx.exe 22116 [ws@4413 threadName="vmx"] hostCPUID level 00000013, 0: 0x00000000 0x00000000 0x00000000 0x00000000
2025-12-14T09:04:57.129Z -INFO vmware-vmx.exe 22116 [ws@4413 threadName="vmx"] hostCPUID level 00000014, 0: 0x00000001 0x0000000f 0x00000007 0x00000000
2025-12-14T09:04:57.129Z -INFO vmware-vmx.exe 22116 [ws@4413 threadName="vmx"] hostCPUID level 00000014, 1: 0x02490002 0x003f3fff 0x00000000 0x00000000
2025-12-14T09:04:57.129Z -INFO vmware-vmx.exe 22116 [ws@4413 threadName="vmx"] hostCPUID level 00000015, 0: 0x00000002 0x0000010a 0x00000000 0x00000000
2025-12-14T09:04:57.130Z -INFO vmware-vmx.exe 22116 [ws@4413 threadName="vmx"] hostCPUID level 00000016, 0: 0x00000c80 0x000011f8 0x00000064 0x00000000
2025-12-14T09:04:57.130Z -INFO vmware-vmx.exe 22116 [ws@4413 threadName="vmx"] hostCPUID level 80000000, 0: 0x80000008 0x00000000 0x00000000 0x00000000
2025-12-14T09:04:57.130Z -INFO vmware-vmx.exe 22116 [ws@4413 threadName="vmx"] hostCPUID level 80000001, 0: 0x00000000 0x00000000 0x00000121 0x2c100800
2025-12-14T09:04:57.130Z -INFO vmware-vmx.exe 22116 [ws@4413 threadName="vmx"] hostCPUID level 80000002, 0: 0x65746e49 0x2952286c 0x726f4320 0x4d542865
2025-12-14T09:04:57.130Z -INFO vmware-vmx.exe 22116 [ws@4413 threadName="vmx"] hostCPUID level 80000003, 0: 0x37692029 0x3037382d 0x50432030 0x20402055
2025-12-14T09:04:57.130Z -INFO vmware-vmx.exe 22116 [ws@4413 threadName="vmx"] hostCPUID level 80000004, 0: 0x30322e33 0x007a4847 0x00000000 0x00000000
2025-12-14T09:04:57.130Z -INFO vmware-vmx.exe 22116 [ws@4413 threadName="vmx"] hostCPUID level 80000005, 0: 0x00000000 0x00000000 0x00000000 0x00000000
2025-12-14T09:04:57.130Z -INFO vmware-vmx.exe 22116 [ws@4413 threadName="vmx"] hostCPUID level 80000006, 0: 0x00000000 0x00000000 0x01006040 0x00000000
2025-12-14T09:04:57.130Z -INFO vmware-vmx.exe 22116 [ws@4413 threadName="vmx"] hostCPUID level 80000007, 0: 0x00000000 0x00000000 0x00000000 0x00000100
2025-12-14T09:04:57.130Z -INFO vmware-vmx.exe 22116 [ws@4413 threadName="vmx"] hostCPUID level 80000008, 0: 0x00003027 0x00000000 0x00000000 0x00000000
2025-12-14T09:04:57.130Z -INFO vmware-vmx.exe 22116 [ws@4413 threadName="vmx"] CPUID differences from hostCPUID.
2025-12-14T09:04:57.130Z -INFO vmware-vmx.exe 22116 [ws@4413 threadName="vmx"] Physical APIC IDs: 0-11
2025-12-14T09:04:57.130Z -INFO vmware-vmx.exe 22116 [ws@4413 threadName="vmx"] Physical X2APIC IDs: 0-11
2025-12-14T09:04:57.130Z -INFO vmware-vmx.exe 22116 [ws@4413 threadName="vmx"] Common: MSR 0x3a = 0x20005
2025-12-14T09:04:57.130Z -INFO vmware-vmx.exe 22116 [ws@4413 threadName="vmx"] Common: MSR 0x480 = 0xda040000000004
2025-12-14T09:04:57.130Z -INFO vmware-vmx.exe 22116 [ws@4413 threadName="vmx"] Common: MSR 0x481 = 0x7f00000016
2025-12-14T09:04:57.130Z -INFO vmware-vmx.exe 22116 [ws@4413 threadName="vmx"] Common: MSR 0x482 = 0xfff9fffe0401e172
2025-12-14T09:04:57.130Z -INFO vmware-vmx.exe 22116 [ws@4413 threadName="vmx"] Common: MSR 0x483 = 0x1ffffff00036dff
2025-12-14T09:04:57.130Z -INFO vmware-vmx.exe 22116 [ws@4413 threadName="vmx"] Common: MSR 0x484 = 0x3ffff000011ff
2025-12-14T09:04:57.130Z -INFO vmware-vmx.exe 22116 [ws@4413 threadName="vmx"] Common: MSR 0x485 = 0x7004c1e7
2025-12-14T09:04:57.130Z -INFO vmware-vmx.exe 22116 [ws@4413 threadName="vmx"] Common: MSR 0x486 = 0x80000021
2025-12-14T09:04:57.130Z -INFO vmware-vmx.exe 22116 [ws@4413 threadName="vmx"] Common: MSR 0x487 = 0xffffffff
2025-12-14T09:04:57.130Z -INFO vmware-vmx.exe 22116 [ws@4413 threadName="vmx"] Common: MSR 0x488 = 0x2000
2025-12-14T09:04:57.130Z -INFO vmware-vmx.exe 22116 [ws@4413 threadName="vmx"] Common: MSR 0x489 = 0x3767ff
2025-12-14T09:04:57.130Z -INFO vmware-vmx.exe 22116 [ws@4413 threadName="vmx"] Common: MSR 0x48a = 0x2e
2025-12-14T09:04:57.130Z -INFO vmware-vmx.exe 22116 [ws@4413 threadName="vmx"] Common: MSR 0x48b = 0x5ffcff00000000
2025-12-14T09:04:57.130Z -INFO vmware-vmx.exe 22116 [ws@4413 threadName="vmx"] Common: MSR 0x48c = 0xf0106734141
2025-12-14T09:04:57.130Z -INFO vmware-vmx.exe 22116 [ws@4413 threadName="vmx"] Common: MSR 0x48d = 0x7f00000016
2025-12-14T09:04:57.130Z -INFO vmware-vmx.exe 22116 [ws@4413 threadName="vmx"] Common: MSR 0x48e = 0xfff9fffe04006172
2025-12-14T09:04:57.130Z -INFO vmware-vmx.exe 22116 [ws@4413 threadName="vmx"] Common: MSR 0x48f = 0x1ffffff00036dfb
2025-12-14T09:04:57.130Z -INFO vmware-vmx.exe 22116 [ws@4413 threadName="vmx"] Common: MSR 0x490 = 0x3ffff000011fb
2025-12-14T09:04:57.130Z -INFO vmware-vmx.exe 22116 [ws@4413 threadName="vmx"] Common: MSR 0x491 = 0x1
2025-12-14T09:04:57.130Z -INFO vmware-vmx.exe 22116 [ws@4413 threadName="vmx"] Common: MSR 0x492 = 0
2025-12-14T09:04:57.130Z -INFO vmware-vmx.exe 22116 [ws@4413 threadName="vmx"] Common: MSR 0x493 = 0
2025-12-14T09:04:57.130Z -INFO vmware-vmx.exe 22116 [ws@4413 threadName="vmx"] Common: MSR 0xc0010114 = 0
2025-12-14T09:04:57.130Z -INFO vmware-vmx.exe 22116 [ws@4413 threadName="vmx"] Common: MSR 0xce = 0x80000000
2025-12-14T09:04:57.130Z -INFO vmware-vmx.exe 22116 [ws@4413 threadName="vmx"] Common: MSR 0x10a = 0xc04
2025-12-14T09:04:57.130Z -INFO vmware-vmx.exe 22116 [ws@4413 threadName="vmx"] Common: MSR 0x122 = 0
2025-12-14T09:04:57.130Z -INFO vmware-vmx.exe 22116 [ws@4413 threadName="vmx"] Common: MSR 0x123 = 0
2025-12-14T09:04:57.130Z -INFO vmware-vmx.exe 22116 [ws@4413 threadName="vmx"] VMMon_GetkHzEstimate: Calculated 3192001 kHz
2025-12-14T09:04:57.130Z -INFO vmware-vmx.exe 22116 [ws@4413 threadName="vmx"] TSC Hz estimates: vmmon 3192001000, remembered 0, osReported 3192000000. Using 3192001000 Hz.
2025-12-14T09:04:57.130Z -INFO vmware-vmx.exe 22116 [ws@4413 threadName="vmx"] TSC first measured delta 514
2025-12-14T09:04:57.130Z -INFO vmware-vmx.exe 22116 [ws@4413 threadName="vmx"] TSC min delta 353
2025-12-14T09:04:57.130Z -INFO vmware-vmx.exe 22116 [ws@4413 threadName="vmx"] PTSC: RefClockToPTSC 0 @ 10000000Hz -> 0 @ 3192001000Hz
2025-12-14T09:04:57.130Z -INFO vmware-vmx.exe 22116 [ws@4413 threadName="vmx"] PTSC: RefClockToPTSC ((x * 2677644512) >> 23) + -17901121686374
2025-12-14T09:04:57.130Z -INFO vmware-vmx.exe 22116 [ws@4413 threadName="vmx"] PTSC: tscOffset -17967958464636
2025-12-14T09:04:57.130Z -INFO vmware-vmx.exe 22116 [ws@4413 threadName="vmx"] PTSC: using TSC
2025-12-14T09:04:57.130Z -INFO vmware-vmx.exe 22116 [ws@4413 threadName="vmx"] PTSC: hardware TSCs are synchronized.
2025-12-14T09:04:57.130Z -INFO vmware-vmx.exe 22116 [ws@4413 threadName="vmx"] PTSC: hardware TSCs may have been adjusted by the host.
2025-12-14T09:04:57.130Z -INFO vmware-vmx.exe 22116 [ws@4413 threadName="vmx"] PTSC: current PTSC=215421
2025-12-14T09:04:57.138Z -INFO vmware-vmx.exe 22116 [ws@4413 threadName="vmx"] WQPoolAllocPoll : pollIx = 3, signalHandle = 1256
2025-12-14T09:04:57.168Z -INFO vmware-vmx.exe 22116 [ws@4413 threadName="vmx"] ConfigVMX_Load: Loaded D:\VM\mb\mb.vmx in 933 us
2025-12-14T09:04:57.168Z -INFO vmware-vmx.exe 22116 [ws@4413 threadName="vmx"] ConfigCheck: No rules file found. Checks are disabled.
2025-12-14T09:04:57.168Z -INFO vmware-vmx.exe 22116 [ws@4413 threadName="vmx"] changing directory to D:\VM\mb\.
2025-12-14T09:04:57.169Z -INFO vmware-vmx.exe 22116 [ws@4413 threadName="vmx"] Config file: D:\VM\mb\mb.vmx
2025-12-14T09:04:57.169Z -INFO vmware-vmx.exe 22116 [ws@4413 threadName="vmx"] Vix: [mainDispatch.c:4172]: VMAutomation_ReportPowerOpFinished: statevar=1, newAppState=1873, success=1 additionalError=0
2025-12-14T09:04:57.169Z -INFO vmware-vmx.exe 22116 [ws@4413 threadName="vmx"] Vix: [mainDispatch.c:4172]: VMAutomation_ReportPowerOpFinished: statevar=2, newAppState=1878, success=1 additionalError=0
2025-12-14T09:04:57.181Z -INFO vmware-vmx.exe 22116 [ws@4413 threadName="vmx"] LogRotation: Rotating to a new log file (keepOld 3) took 0.008961 seconds.
2025-12-14T09:04:57.182Z -NOTICE vmware-vmx.exe 22116 [ws@4413 threadName="vmx"] LogVMXReplace: Successful switching from temporary to permanent log file took 0.010188 seconds.
2025-12-14T09:04:57.184Z -INFO vmware-vmx.exe 22116 [ws@4413 threadName="vmx"] distroName is 'windows'
2025-12-14T09:04:57.209Z -WARNING vmware-vmx.exe 22116 [ws@4413 threadName="vmx"] PowerOn
2025-12-14T09:04:57.209Z -INFO vmware-vmx.exe 22116 [ws@4413 threadName="vmx"] VMX_PowerOn: VMX build 24995812, UI build 24995812
2025-12-14T09:04:57.209Z -INFO vmware-vmx.exe 22116 [ws@4413 threadName="vmx"] HostWin32: WIN32 NUMA node 0, CPU mask 0x0000000000000fff
2025-12-14T09:04:57.215Z -INFO vmware-vmx.exe 22116 [ws@4413 threadName="vmx"] Vix: [mainDispatch.c:4172]: VMAutomation_ReportPowerOpFinished: statevar=0, newAppState=1871, success=1 additionalError=0
2025-12-14T09:04:57.219Z -INFO vmware-vmx.exe 22116 [ws@4413 threadName="vmx"] STATSFILE: StatsFile 'D:\VM\mb\mb.scoreboard' created
2025-12-14T09:04:57.219Z -INFO vmware-vmx.exe 22116 [ws@4413 threadName="vmx"] HOST Windows version 10.0, build 26200, platform 2, ""
2025-12-14T09:04:57.219Z -INFO vmware-vmx.exe 22116 [ws@4413 threadName="vmx"] DICT --- GLOBAL SETTINGS C:\ProgramData\VMware\VMware Workstation\settings.ini
2025-12-14T09:04:57.219Z -INFO vmware-vmx.exe 22116 [ws@4413 threadName="vmx"] DICT printers.enabled = "FALSE"
2025-12-14T09:04:57.219Z -INFO vmware-vmx.exe 22116 [ws@4413 threadName="vmx"] DICT --- NON PERSISTENT (null)
2025-12-14T09:04:57.219Z -INFO vmware-vmx.exe 22116 [ws@4413 threadName="vmx"] DICT --- USER PREFERENCES C:\Users\mb\AppData\Roaming\VMware\preferences.ini
2025-12-14T09:04:57.219Z -INFO vmware-vmx.exe 22116 [ws@4413 threadName="vmx"] DICT pref.componentDownloadPermission.epoch = ""
2025-12-14T09:04:57.219Z -INFO vmware-vmx.exe 22116 [ws@4413 threadName="vmx"] DICT pref.componentDownloadPermission = "deny"
2025-12-14T09:04:57.219Z -INFO vmware-vmx.exe 22116 [ws@4413 threadName="vmx"] DICT pref.keyboardAndMouse.vmHotKey.enabled = "FALSE"
2025-12-14T09:04:57.219Z -INFO vmware-vmx.exe 22116 [ws@4413 threadName="vmx"] DICT pref.keyboardAndMouse.vmHotKey.count = "0"
2025-12-14T09:04:57.219Z -INFO vmware-vmx.exe 22116 [ws@4413 threadName="vmx"] DICT pref.defaultVirtualHW.productCompatSSlity = "esx"
2025-12-14T09:04:57.219Z -INFO vmware-vmx.exe 22116 [ws@4413 threadName="vmx"] DICT pref.ws.shareVMEnable = "TRUE"
2025-12-14T09:04:57.219Z -INFO vmware-vmx.exe 22116 [ws@4413 threadName="vmx"] DICT pref.hostMRU.count = "2"
2025-12-14T09:04:57.219Z -INFO vmware-vmx.exe 22116 [ws@4413 threadName="vmx"] DICT pref.hostMRU0.name = "localhost"
2025-12-14T09:04:57.219Z -INFO vmware-vmx.exe 22116 [ws@4413 threadName="vmx"] DICT pref.hostMRU0.type = "vim"
2025-12-14T09:04:57.219Z -INFO vmware-vmx.exe 22116 [ws@4413 threadName="vmx"] DICT pref.hostMRU0.viewtype = "vmView"
2025-12-14T09:04:57.219Z -INFO vmware-vmx.exe 22116 [ws@4413 threadName="vmx"] DICT pref.ws.session.window.count = "1"
2025-12-14T09:04:57.219Z -INFO vmware-vmx.exe 22116 [ws@4413 threadName="vmx"] DICT pref.ws.session.window0.tab.count = "1"
2025-12-14T09:04:57.219Z -INFO vmware-vmx.exe 22116 [ws@4413 threadName="vmx"] DICT pref.ws.session.window0.tab0.cnxType = "vmdb"
2025-12-14T09:04:57.219Z -INFO vmware-vmx.exe 22116 [ws@4413 threadName="vmx"] DICT pref.ws.session.window0.sidebar = "FALSE"
2025-12-14T09:04:57.219Z -INFO vmware-vmx.exe 22116 [ws@4413 threadName="vmx"] DICT pref.ws.session.window0.sidebar.width = "200"
2025-12-14T09:04:57.219Z -INFO vmware-vmx.exe 22116 [ws@4413 threadName="vmx"] DICT pref.ws.session.window0.statusBar = "FALSE"
2025-12-14T09:04:57.219Z -INFO vmware-vmx.exe 22116 [ws@4413 threadName="vmx"] DICT pref.ws.session.window0.tabs = "FALSE"
2025-12-14T09:04:57.219Z -INFO vmware-vmx.exe 22116 [ws@4413 threadName="vmx"] DICT pref.ws.session.window0.thumbnailBar = "FALSE"
2025-12-14T09:04:57.219Z -INFO vmware-vmx.exe 22116 [ws@4413 threadName="vmx"] DICT pref.ws.session.window0.thumbnailBar.size = "100"
2025-12-14T09:04:57.219Z -INFO vmware-vmx.exe 22116 [ws@4413 threadName="vmx"] DICT pref.ws.session.window0.thumbnailBar.view = "opened-vms"
2025-12-14T09:04:57.219Z -INFO vmware-vmx.exe 22116 [ws@4413 threadName="vmx"] DICT pref.ws.session.window0.placement.left = "421"
2025-12-14T09:04:57.219Z -INFO vmware-vmx.exe 22116 [ws@4413 threadName="vmx"] DICT pref.ws.session.window0.placement.top = "223"
2025-12-14T09:04:57.219Z -INFO vmware-vmx.exe 22116 [ws@4413 threadName="vmx"] DICT pref.ws.session.window0.placement.right = "3823"
2025-12-14T09:04:57.219Z -INFO vmware-vmx.exe 22116 [ws@4413 threadName="vmx"] DICT pref.ws.session.window0.placement.bottom = "1932"
2025-12-14T09:04:57.219Z -INFO vmware-vmx.exe 22116 [ws@4413 threadName="vmx"] DICT pref.ws.session.window0.maximized = "TRUE"
2025-12-14T09:04:57.219Z -INFO vmware-vmx.exe 22116 [ws@4413 threadName="vmx"] DICT vmWizard.isoLocationMRU.count = "10"
2025-12-14T09:04:57.219Z -INFO vmware-vmx.exe 22116 [ws@4413 threadName="vmx"] DICT vmWizard.isoLocationMRU0.location = "E:\data\tech\20_BOOTCD_AND_RECOVERY\Active@_Boot_Disk_v4.1.4___Hiren's_BootCD_9.9___Acronis_BootCD_Reanimator_4.2009___DrWeb_Live\ActiveBootDisk_v4.1.4Hirens_BootCD_9.9AcronisBootCD.iso"
2025-12-14T09:04:57.219Z -INFO vmware-vmx.exe 22116 [ws@4413 threadName="vmx"] DICT vmWizard.guestKey = "windows9srv-64"
2025-12-14T09:04:57.219Z -INFO vmware-vmx.exe 22116 [ws@4413 threadName="vmx"] DICT vmWizard.mode = "custom"
2025-12-14T09:04:57.219Z -INFO vmware-vmx.exe 22116 [ws@4413 threadName="vmx"] DICT vmWizard.installMediaType = "later"
2025-12-14T09:04:57.219Z -INFO vmware-vmx.exe 22116 [ws@4413 threadName="vmx"] DICT pref.ws.session.window0.tab1.cnxType = "vmdb"
2025-12-14T09:04:57.219Z -INFO vmware-vmx.exe 22116 [ws@4413 threadName="vmx"] DICT pref.sharedFolder.maxNum = "7"
2025-12-14T09:04:57.219Z -INFO vmware-vmx.exe 22116 [ws@4413 threadName="vmx"] DICT pref.sharedFolder0.vmPath = "/vm/#393e866fadc61fa9/"
2025-12-14T09:04:57.219Z -INFO vmware-vmx.exe 22116 [ws@4413 threadName="vmx"] DICT pref.sharedFolder0.guestName = "Debug"
2025-12-14T09:04:57.219Z -INFO vmware-vmx.exe 22116 [ws@4413 threadName="vmx"] DICT pref.sharedFolder0.enabled = "TRUE"
2025-12-14T09:04:57.219Z -INFO vmware-vmx.exe 22116 [ws@4413 threadName="vmx"] DICT pref.commandBar.toolbarEnabled = "FALSE"
2025-12-14T09:04:57.219Z -INFO vmware-vmx.exe 22116 [ws@4413 threadName="vmx"] DICT hints.hideAll = "FALSE"
2025-12-14T09:04:57.219Z -INFO vmware-vmx.exe 22116 [ws@4413 threadName="vmx"] DICT pref.sharedFolder1.vmPath = "/vm/#393e866fadc61fa9/"
2025-12-14T09:04:57.219Z -INFO vmware-vmx.exe 22116 [ws@4413 threadName="vmx"] DICT pref.sharedFolder1.guestName = "SS"
2025-12-14T09:04:57.219Z -INFO vmware-vmx.exe 22116 [ws@4413 threadName="vmx"] DICT pref.sharedFolder1.hostPath = "D:\DATA\mb"
2025-12-14T09:04:57.219Z -INFO vmware-vmx.exe 22116 [ws@4413 threadName="vmx"] DICT pref.sharedFolder1.enabled = "TRUE"
2025-12-14T09:04:57.219Z -INFO vmware-vmx.exe 22116 [ws@4413 threadName="vmx"] DICT pref.hostMRU1.type = "vim"
2025-12-14T09:04:57.219Z -INFO vmware-vmx.exe 22116 [ws@4413 threadName="vmx"] DICT pref.hostMRU1.viewtype = "vmView"
2025-12-14T09:04:57.219Z -INFO vmware-vmx.exe 22116 [ws@4413 threadName="vmx"] DICT pref.ws.session.window0.tab2.cnxType = "vmdb"
2025-12-14T09:04:57.219Z -INFO vmware-vmx.exe 22116 [ws@4413 threadName="vmx"] DICT pref.snapshotManager.left = "0"
2025-12-14T09:04:57.219Z -INFO vmware-vmx.exe 22116 [ws@4413 threadName="vmx"] DICT pref.snapshotManager.top = "23"
2025-12-14T09:04:57.219Z -INFO vmware-vmx.exe 22116 [ws@4413 threadName="vmx"] DICT pref.snapshotManager.right = "687"
2025-12-14T09:04:57.219Z -INFO vmware-vmx.exe 22116 [ws@4413 threadName="vmx"] DICT pref.snapshotManager.bottom = "539"
2025-12-14T09:04:57.219Z -INFO vmware-vmx.exe 22116 [ws@4413 threadName="vmx"] DICT pref.ws.session.window0.tab3.cnxType = "vmdb"
2025-12-14T09:04:57.219Z -INFO vmware-vmx.exe 22116 [ws@4413 threadName="vmx"] DICT pref.autoFitGuestToWindow = "TRUE"
2025-12-14T09:04:57.219Z -INFO vmware-vmx.exe 22116 [ws@4413 threadName="vmx"] DICT pref.autoFit = "TRUE"
2025-12-14T09:04:57.219Z -INFO vmware-vmx.exe 22116 [ws@4413 threadName="vmx"] DICT pref.grabOnKeyPress = "TRUE"
2025-12-14T09:04:57.219Z -INFO vmware-vmx.exe 22116 [ws@4413 threadName="vmx"] DICT pref.gamingMouseMode = "absoluteMouse"
2025-12-14T09:04:57.219Z -INFO vmware-vmx.exe 22116 [ws@4413 threadName="vmx"] DICT pref.sharedFolder2.vmPath = "/vm/#3b10a0d6e455ed17/"
2025-12-14T09:04:57.219Z -INFO vmware-vmx.exe 22116 [ws@4413 threadName="vmx"] DICT pref.sharedFolder2.guestName = "SS"
2025-12-14T09:04:57.219Z -INFO vmware-vmx.exe 22116 [ws@4413 threadName="vmx"] DICT pref.sharedFolder2.hostPath = "D:\DATA\mb"
2025-12-14T09:04:57.219Z -INFO vmware-vmx.exe 22116 [ws@4413 threadName="vmx"] DICT pref.sharedFolder2.enabled = "TRUE"
2025-12-14T09:04:57.219Z -INFO vmware-vmx.exe 22116 [ws@4413 threadName="vmx"] DICT pref.sharedFolder3.vmPath = "/vm/#433a1a425c7471d6/"
2025-12-14T09:04:57.219Z -INFO vmware-vmx.exe 22116 [ws@4413 threadName="vmx"] DICT pref.sharedFolder3.guestName = "data"
2025-12-14T09:04:57.219Z -INFO vmware-vmx.exe 22116 [ws@4413 threadName="vmx"] DICT pref.sharedFolder3.hostPath = "D:\data"
2025-12-14T09:04:57.219Z -INFO vmware-vmx.exe 22116 [ws@4413 threadName="vmx"] DICT pref.sharedFolder3.enabled = "FALSE"
2025-12-14T09:04:57.219Z -INFO vmware-vmx.exe 22116 [ws@4413 threadName="vmx"] DICT pref.sharedFolder4.vmPath = "/vm/#5be561833fd2cd84/"
2025-12-14T09:04:57.219Z -INFO vmware-vmx.exe 22116 [ws@4413 threadName="vmx"] DICT pref.sharedFolder4.guestName = "SS"
2025-12-14T09:04:57.219Z -INFO vmware-vmx.exe 22116 [ws@4413 threadName="vmx"] DICT pref.sharedFolder4.hostPath = "D:\DATA\mb"
2025-12-14T09:04:57.220Z -INFO vmware-vmx.exe 22116 [ws@4413 threadName="vmx"] DICT pref.sharedFolder4.enabled = "FALSE"
2025-12-14T09:04:57.220Z -INFO vmware-vmx.exe 22116 [ws@4413 threadName="vmx"] DICT authd.proxy.nfc = "vmware-hostd:ha-nfc"
2025-12-14T09:04:57.220Z -INFO vmware-vmx.exe 22116 [ws@4413 threadName="vmx"] DICT installerDefaults.autoSoftwareUpdateEnabled = "no"
2025-12-14T09:04:57.220Z -INFO vmware-vmx.exe 22116 [ws@4413 threadName="vmx"] DICT installerDefaults.autoSoftwareUpdateEnabled.epoch = "24049"
2025-12-14T09:04:57.220Z -INFO vmware-vmx.exe 22116 [ws@4413 threadName="vmx"] DICT installerDefaults.componentDownloadEnabled = "yes"
2025-12-14T09:04:57.220Z -INFO vmware-vmx.exe 22116 [ws@4413 threadName="vmx"] DICT installerDefaults.dataCollectionEnabled = "no"
2025-12-14T09:04:57.220Z -INFO vmware-vmx.exe 22116 [ws@4413 threadName="vmx"] DICT installerDefaults.dataCollectionEnabled.epoch = "24049"
2025-12-14T09:04:57.220Z -INFO vmware-vmx.exe 22116 [ws@4413 threadName="vmx"] DICT --- SITE DEFAULTS C:\ProgramData\VMware\VMware Workstation\config.ini
2025-12-14T09:04:57.220Z -INFO vmware-vmx.exe 22116 [ws@4413 threadName="vmx"] DICT authd.client.port = "903"
2025-12-14T09:04:57.220Z -INFO vmware-vmx.exe 22116 [ws@4413 threadName="vmx"] DICT authd.proxy.nfc = "vmware-hostd:ha-nfc"
2025-12-14T09:04:57.220Z -INFO vmware-vmx.exe 22116 [ws@4413 threadName="vmx"] DICT installerDefaults.autoSoftwareUpdateEnabled = "no"
2025-12-14T09:04:57.220Z -INFO vmware-vmx.exe 22116 [ws@4413 threadName="vmx"] DICT installerDefaults.autoSoftwareUpdateEnabled.epoch = "24049"
2025-12-14T09:04:57.220Z -INFO vmware-vmx.exe 22116 [ws@4413 threadName="vmx"] DICT installerDefaults.componentDownloadEnabled = "yes"
2025-12-14T09:04:57.220Z -INFO vmware-vmx.exe 22116 [ws@4413 threadName="vmx"] DICT installerDefaults.dataCollectionEnabled = "no"
2025-12-14T09:04:57.220Z -INFO vmware-vmx.exe 22116 [ws@4413 threadName="vmx"] DICT installerDefaults.dataCollectionEnabled.epoch = "24049"
2025-12-14T09:04:57.220Z -INFO vmware-vmx.exe 22116 [ws@4413 threadName="vmx"] DICT --- NONPERSISTENT
2025-12-14T09:04:57.220Z -INFO vmware-vmx.exe 22116 [ws@4413 threadName="vmx"] DICT vmx.stdio.keep = "TRUE"
2025-12-14T09:04:57.220Z -INFO vmware-vmx.exe 22116 [ws@4413 threadName="vmx"] DICT --- COMMAND LINE
2025-12-14T09:04:57.220Z -INFO vmware-vmx.exe 22116 [ws@4413 threadName="vmx"] DICT vmx.stdio.keep = "TRUE"
2025-12-14T09:04:57.220Z -INFO vmware-vmx.exe 22116 [ws@4413 threadName="vmx"] DICT --- RECORDING
2025-12-14T09:04:57.220Z -INFO vmware-vmx.exe 22116 [ws@4413 threadName="vmx"] DICT vmx.stdio.keep = "TRUE"
2025-12-14T09:04:57.220Z -INFO vmware-vmx.exe 22116 [ws@4413 threadName="vmx"] DICT --- CONFIGURATION D:\VM\mb\mb.vmx
2025-12-14T09:04:57.220Z -INFO vmware-vmx.exe 22116 [ws@4413 threadName="vmx"] DICT displayName = "SS"
2025-12-14T09:04:57.220Z -INFO vmware-vmx.exe 22116 [ws@4413 threadName="vmx"] DICT config.version = "8"
2025-12-14T09:04:57.220Z -INFO vmware-vmx.exe 22116 [ws@4413 threadName="vmx"] DICT virtualHW.version = "16"
2025-12-14T09:04:57.220Z -INFO vmware-vmx.exe 22116 [ws@4413 threadName="vmx"] DICT mks.enable3d = "TRUE"
2025-12-14T09:04:57.220Z -INFO vmware-vmx.exe 22116 [ws@4413 threadName="vmx"] DICT pciBridge0.present = "TRUE"
2025-12-14T09:04:57.220Z -INFO vmware-vmx.exe 22116 [ws@4413 threadName="vmx"] DICT pciBridge4.present = "TRUE"
2025-12-14T09:04:57.220Z -INFO vmware-vmx.exe 22116 [ws@4413 threadName="vmx"] DICT pciBridge4.virtualDev = "pcieRootPort"
2025-12-14T09:04:57.220Z -INFO vmware-vmx.exe 22116 [ws@4413 threadName="vmx"] DICT pciBridge4.functions = "8"
2025-12-14T09:04:57.220Z -INFO vmware-vmx.exe 22116 [ws@4413 threadName="vmx"] DICT pciBridge5.present = "TRUE"
2025-12-14T09:04:57.220Z -INFO vmware-vmx.exe 22116 [ws@4413 threadName="vmx"] DICT pciBridge5.virtualDev = "pcieRootPort"
2025-12-14T09:04:57.220Z -INFO vmware-vmx.exe 22116 [ws@4413 threadName="vmx"] DICT pciBridge5.functions = "8"
2025-12-14T09:04:57.220Z -INFO vmware-vmx.exe 22116 [ws@4413 threadName="vmx"] DICT pciBridge6.present = "TRUE"
2025-12-14T09:04:57.220Z -INFO vmware-vmx.exe 22116 [ws@4413 threadName="vmx"] DICT pciBridge6.virtualDev = "pcieRootPort"
2025-12-14T09:04:57.220Z -INFO vmware-vmx.exe 22116 [ws@4413 threadName="vmx"] DICT pciBridge6.functions = "8"
2025-12-14T09:04:57.220Z -INFO vmware-vmx.exe 22116 [ws@4413 threadName="vmx"] DICT pciBridge7.present = "TRUE"
2025-12-14T09:04:57.220Z -INFO vmware-vmx.exe 22116 [ws@4413 threadName="vmx"] DICT pciBridge7.virtualDev = "pcieRootPort"
2025-12-14T09:04:57.220Z -INFO vmware-vmx.exe 22116 [ws@4413 threadName="vmx"] DICT pciBridge7.functions = "8"
2025-12-14T09:04:57.220Z -INFO vmware-vmx.exe 22116 [ws@4413 threadName="vmx"] DICT vmci0.present = "TRUE"
2025-12-14T09:04:57.220Z -INFO vmware-vmx.exe 22116 [ws@4413 threadName="vmx"] DICT hpet0.present = "TRUE"
2025-12-14T09:04:57.220Z -INFO vmware-vmx.exe 22116 [ws@4413 threadName="vmx"] DICT guestOS = "windows9-64"
2025-12-14T09:04:57.220Z -INFO vmware-vmx.exe 22116 [ws@4413 threadName="vmx"] DICT nvram = "SS.nvram"
2025-12-14T09:04:57.220Z -INFO vmware-vmx.exe 22116 [ws@4413 threadName="vmx"] DICT virtualHW.productCompatSSlity = "hosted"
2025-12-14T09:04:57.220Z -INFO vmware-vmx.exe 22116 [ws@4413 threadName="vmx"] DICT powerType.powerOff = "soft"
2025-12-14T09:04:57.220Z -INFO vmware-vmx.exe 22116 [ws@4413 threadName="vmx"] DICT powerType.powerOn = "soft"
2025-12-14T09:04:57.220Z -INFO vmware-vmx.exe 22116 [ws@4413 threadName="vmx"] DICT powerType.suspend = "soft"
2025-12-14T09:04:57.220Z -INFO vmware-vmx.exe 22116 [ws@4413 threadName="vmx"] DICT powerType.reset = "soft"
2025-12-14T09:04:57.220Z -INFO vmware-vmx.exe 22116 [ws@4413 threadName="vmx"] DICT usb.vbluetooth.startConnected = "TRUE"
2025-12-14T09:04:57.220Z -INFO vmware-vmx.exe 22116 [ws@4413 threadName="vmx"] DICT sensor.location = "pass-through"
2025-12-14T09:04:57.220Z -INFO vmware-vmx.exe 22116 [ws@4413 threadName="vmx"] DICT tools.syncTime = "FALSE"
2025-12-14T09:04:57.220Z -INFO vmware-vmx.exe 22116 [ws@4413 threadName="vmx"] DICT sound.virtualDev = "hdaudio"
2025-12-14T09:04:57.220Z -INFO vmware-vmx.exe 22116 [ws@4413 threadName="vmx"] DICT sound.present = "TRUE"
2025-12-14T09:04:57.220Z -INFO vmware-vmx.exe 22116 [ws@4413 threadName="vmx"] DICT numvcpus = "2"
2025-12-14T09:04:57.220Z -INFO vmware-vmx.exe 22116 [ws@4413 threadName="vmx"] DICT cpuid.coresPerSocket = "2"
2025-12-14T09:04:57.220Z -INFO vmware-vmx.exe 22116 [ws@4413 threadName="vmx"] DICT memsize = "6144"
2025-12-14T09:04:57.220Z -INFO vmware-vmx.exe 22116 [ws@4413 threadName="vmx"] DICT mem.hotadd = "TRUE"
2025-12-14T09:04:57.220Z -INFO vmware-vmx.exe 22116 [ws@4413 threadName="vmx"] DICT scsi0.virtualDev = "lsisas1068"
2025-12-14T09:04:57.220Z -INFO vmware-vmx.exe 22116 [ws@4413 threadName="vmx"] DICT scsi0.present = "TRUE"
2025-12-14T09:04:57.220Z -INFO vmware-vmx.exe 22116 [ws@4413 threadName="vmx"] DICT sata0.present = "TRUE"
2025-12-14T09:04:57.220Z -INFO vmware-vmx.exe 22116 [ws@4413 threadName="vmx"] DICT scsi0:0.fileName = "SS.vmdk"
2025-12-14T09:04:57.220Z -INFO vmware-vmx.exe 22116 [ws@4413 threadName="vmx"] DICT scsi0:0.present = "TRUE"
2025-12-14T09:04:57.220Z -INFO vmware-vmx.exe 22116 [ws@4413 threadName="vmx"] DICT sata0:1.deviceType = "cdrom-image"
2025-12-14T09:04:57.220Z -INFO vmware-vmx.exe 22116 [ws@4413 threadName="vmx"] DICT sata0:1.fileName =
2025-12-14T09:04:57.220Z -INFO vmware-vmx.exe 22116 [ws@4413 threadName="vmx"] DICT sata0:1.present = "TRUE"
2025-12-14T09:04:57.220Z -INFO vmware-vmx.exe 22116 [ws@4413 threadName="vmx"] DICT usb.present = "TRUE"
2025-12-14T09:04:57.220Z -INFO vmware-vmx.exe 22116 [ws@4413 threadName="vmx"] DICT ehci.present = "TRUE"
2025-12-14T09:04:57.220Z -INFO vmware-vmx.exe 22116 [ws@4413 threadName="vmx"] DICT usb_xhci.present = "TRUE"
2025-12-14T09:04:57.220Z -INFO vmware-vmx.exe 22116 [ws@4413 threadName="vmx"] DICT svga.graphicsMemoryKB = "2097152"
2025-12-14T09:04:57.220Z -INFO vmware-vmx.exe 22116 [ws@4413 threadName="vmx"] DICT ethernet0.connectionType = "nat"
2025-12-14T09:04:57.220Z -INFO vmware-vmx.exe 22116 [ws@4413 threadName="vmx"] DICT ethernet0.addressType = "generated"
2025-12-14T09:04:57.220Z -INFO vmware-vmx.exe 22116 [ws@4413 threadName="vmx"] DICT ethernet0.virtualDev = "e1000e"
2025-12-14T09:04:57.220Z -INFO vmware-vmx.exe 22116 [ws@4413 threadName="vmx"] DICT serial0.fileType = "thinprint"
2025-12-14T09:04:57.220Z -INFO vmware-vmx.exe 22116 [ws@4413 threadName="vmx"] DICT serial0.fileName = "thinprint"
2025-12-14T09:04:57.220Z -INFO vmware-vmx.exe 22116 [ws@4413 threadName="vmx"] DICT ethernet0.present = "TRUE"
2025-12-14T09:04:57.220Z -INFO vmware-vmx.exe 22116 [ws@4413 threadName="vmx"] DICT extendedConfigFile = "SS.vmxf"
2025-12-14T09:04:57.220Z -INFO vmware-vmx.exe 22116 [ws@4413 threadName="vmx"] DICT numa.autosize.cookie = "20022"
2025-12-14T09:04:57.220Z -INFO vmware-vmx.exe 22116 [ws@4413 threadName="vmx"] DICT numa.autosize.vcpu.maxPerVirtualNode = "2"
2025-12-14T09:04:57.220Z -INFO vmware-vmx.exe 22116 [ws@4413 threadName="vmx"] DICT scsi0:0.redo = ""
2025-12-14T09:04:57.220Z -INFO vmware-vmx.exe 22116 [ws@4413 threadName="vmx"] DICT pciBridge0.pciSlotNumber = "17"
2025-12-14T09:04:57.220Z -INFO vmware-vmx.exe 22116 [ws@4413 threadName="vmx"] DICT pciBridge4.pciSlotNumber = "21"
2025-12-14T09:04:57.220Z -INFO vmware-vmx.exe 22116 [ws@4413 threadName="vmx"] DICT pciBridge5.pciSlotNumber = "22"
2025-12-14T09:04:57.220Z -INFO vmware-vmx.exe 22116 [ws@4413 threadName="vmx"] DICT pciBridge6.pciSlotNumber = "23"
2025-12-14T09:04:57.220Z -INFO vmware-vmx.exe 22116 [ws@4413 threadName="vmx"] DICT pciBridge7.pciSlotNumber = "24"
2025-12-14T09:04:57.220Z -INFO vmware-vmx.exe 22116 [ws@4413 threadName="vmx"] DICT scsi0.pciSlotNumber = "160"
2025-12-14T09:04:57.221Z -INFO vmware-vmx.exe 22116 [ws@4413 threadName="vmx"] DICT usb.pciSlotNumber = "32"
2025-12-14T09:04:57.221Z -INFO vmware-vmx.exe 22116 [ws@4413 threadName="vmx"] DICT ethernet0.pciSlotNumber = "192"
2025-12-14T09:04:57.221Z -INFO vmware-vmx.exe 22116 [ws@4413 threadName="vmx"] DICT sound.pciSlotNumber = "33"
2025-12-14T09:04:57.221Z -INFO vmware-vmx.exe 22116 [ws@4413 threadName="vmx"] DICT ehci.pciSlotNumber = "34"
2025-12-14T09:04:57.221Z -INFO vmware-vmx.exe 22116 [ws@4413 threadName="vmx"] DICT usb_xhci.pciSlotNumber = "224"
2025-12-14T09:04:57.221Z -INFO vmware-vmx.exe 22116 [ws@4413 threadName="vmx"] DICT vmci0.pciSlotNumber = "35"
2025-12-14T09:04:57.221Z -INFO vmware-vmx.exe 22116 [ws@4413 threadName="vmx"] DICT sata0.pciSlotNumber = "36"
2025-12-14T09:04:57.221Z -INFO vmware-vmx.exe 22116 [ws@4413 threadName="vmx"] DICT scsi0.sasWWID = "50 05 05 6b ad d3 df b0"
2025-12-14T09:04:57.221Z -INFO vmware-vmx.exe 22116 [ws@4413 threadName="vmx"] DICT svga.vramSize = "268435456"
2025-12-14T09:04:57.221Z -INFO vmware-vmx.exe 22116 [ws@4413 threadName="vmx"] DICT vmotion.checkpointFBSize = "4194304"
2025-12-14T09:04:57.221Z -INFO vmware-vmx.exe 22116 [ws@4413 threadName="vmx"] DICT vmotion.checkpointSVGAPrimarySize = "268435456"
2025-12-14T09:04:57.221Z -INFO vmware-vmx.exe 22116 [ws@4413 threadName="vmx"] DICT ethernet0.generatedAddress = "00:0c:29:93:5d:93"
2025-12-14T09:04:57.221Z -INFO vmware-vmx.exe 22116 [ws@4413 threadName="vmx"] DICT ethernet0.generatedAddressOffset = "0"
2025-12-14T09:04:57.221Z -INFO vmware-vmx.exe 22116 [ws@4413 threadName="vmx"] DICT vmci0.id = "-1449960045"
2025-12-14T09:04:57.221Z -INFO vmware-vmx.exe 22116 [ws@4413 threadName="vmx"] DICT monitor.phys_bits_used = "43"
2025-12-14T09:04:57.221Z -INFO vmware-vmx.exe 22116 [ws@4413 threadName="vmx"] DICT softPowerOff = "FALSE"
2025-12-14T09:04:57.221Z -INFO vmware-vmx.exe 22116 [ws@4413 threadName="vmx"] DICT toolsInstallManager.lastInstallError = "0"
2025-12-14T09:04:57.221Z -INFO vmware-vmx.exe 22116 [ws@4413 threadName="vmx"] DICT svga.guestBackedPrimaryAware = "TRUE"
2025-12-14T09:04:57.221Z -INFO vmware-vmx.exe 22116 [ws@4413 threadName="vmx"] DICT tools.remindInstall = "FALSE"
2025-12-14T09:04:57.221Z -INFO vmware-vmx.exe 22116 [ws@4413 threadName="vmx"] DICT toolsInstallManager.updateCounter = "14"
2025-12-14T09:04:57.221Z -INFO vmware-vmx.exe 22116 [ws@4413 threadName="vmx"] DICT guestOS.detailed.data = "bitness='64' buildNumber='19045' distroName='Windows' distroVersion='10.0' familyName='Windows' kernelVersion='19045.2965' prettyName='Windows 10 Pro, 64-bit (Build 19045.2965)'"
2025-12-14T09:04:57.221Z -INFO vmware-vmx.exe 22116 [ws@4413 threadName="vmx"] DICT isolation.tools.hgfs.disable = "FALSE"
2025-12-14T09:04:57.221Z -INFO vmware-vmx.exe 22116 [ws@4413 threadName="vmx"] DICT sharedFolder0.present = "TRUE"
2025-12-14T09:04:57.221Z -INFO vmware-vmx.exe 22116 [ws@4413 threadName="vmx"] DICT sharedFolder0.enabled = "TRUE"
2025-12-14T09:04:57.221Z -INFO vmware-vmx.exe 22116 [ws@4413 threadName="vmx"] DICT sharedFolder0.readAccess = "TRUE"
2025-12-14T09:04:57.221Z -INFO vmware-vmx.exe 22116 [ws@4413 threadName="vmx"] DICT sharedFolder0.writeAccess = "TRUE"
2025-12-14T09:04:57.221Z -INFO vmware-vmx.exe 22116 [ws@4413 threadName="vmx"] DICT sharedFolder0.hostPath = "D:\DATA\mb"
2025-12-14T09:04:57.221Z -INFO vmware-vmx.exe 22116 [ws@4413 threadName="vmx"] DICT sharedFolder0.guestName = "SS"
2025-12-14T09:04:57.221Z -INFO vmware-vmx.exe 22116 [ws@4413 threadName="vmx"] DICT sharedFolder0.expiration = "never"
2025-12-14T09:04:57.221Z -INFO vmware-vmx.exe 22116 [ws@4413 threadName="vmx"] DICT sharedFolder.maxNum = "1"
2025-12-14T09:04:57.221Z -INFO vmware-vmx.exe 22116 [ws@4413 threadName="vmx"] DICT hgfs.mapRootShare = "TRUE"
2025-12-14T09:04:57.221Z -INFO vmware-vmx.exe 22116 [ws@4413 threadName="vmx"] DICT tools.upgrade.policy = "upgradeAtPowerCycle"
2025-12-14T09:04:57.221Z -INFO vmware-vmx.exe 22116 [ws@4413 threadName="vmx"] DICT usb_xhci:6.speed = "2"
2025-12-14T09:04:57.221Z -INFO vmware-vmx.exe 22116 [ws@4413 threadName="vmx"] DICT usb_xhci:6.present = "TRUE"
2025-12-14T09:04:57.221Z -INFO vmware-vmx.exe 22116 [ws@4413 threadName="vmx"] DICT usb_xhci:6.deviceType = "hub"
2025-12-14T09:04:57.221Z -INFO vmware-vmx.exe 22116 [ws@4413 threadName="vmx"] DICT usb_xhci:6.port = "6"
2025-12-14T09:04:57.221Z -INFO vmware-vmx.exe 22116 [ws@4413 threadName="vmx"] DICT usb_xhci:6.parent = "-1"
2025-12-14T09:04:57.221Z -INFO vmware-vmx.exe 22116 [ws@4413 threadName="vmx"] DICT usb_xhci:7.speed = "4"
2025-12-14T09:04:57.221Z -INFO vmware-vmx.exe 22116 [ws@4413 threadName="vmx"] DICT usb_xhci:7.present = "TRUE"
2025-12-14T09:04:57.221Z -INFO vmware-vmx.exe 22116 [ws@4413 threadName="vmx"] DICT usb_xhci:7.deviceType = "hub"
2025-12-14T09:04:57.221Z -INFO vmware-vmx.exe 22116 [ws@4413 threadName="vmx"] DICT usb_xhci:7.port = "7"
2025-12-14T09:04:57.221Z -INFO vmware-vmx.exe 22116 [ws@4413 threadName="vmx"] DICT usb_xhci:7.parent = "-1"
2025-12-14T09:04:57.221Z -INFO vmware-vmx.exe 22116 [ws@4413 threadName="vmx"] DICT unity.useCustomColor = "TRUE"
2025-12-14T09:04:57.221Z -INFO vmware-vmx.exe 22116 [ws@4413 threadName="vmx"] DICT checkpoint.vmState.readOnly = "FALSE"
2025-12-14T09:04:57.221Z -INFO vmware-vmx.exe 22116 [ws@4413 threadName="vmx"] DICT svga.maxWidth = "5120"
2025-12-14T09:04:57.221Z -INFO vmware-vmx.exe 22116 [ws@4413 threadName="vmx"] DICT svga.maxHeight = "3200"
2025-12-14T09:04:57.221Z -INFO vmware-vmx.exe 22116 [ws@4413 threadName="vmx"] DICT svga.numDisplays = "2"
2025-12-14T09:04:57.221Z -INFO vmware-vmx.exe 22116 [ws@4413 threadName="vmx"] DICT unity.customColor = "#00ff00"
2025-12-14T09:04:57.221Z -INFO vmware-vmx.exe 22116 [ws@4413 threadName="vmx"] DICT priority.grabbed = "high"
2025-12-14T09:04:57.221Z -INFO vmware-vmx.exe 22116 [ws@4413 threadName="vmx"] DICT priority.ungrabbed = "normal"
2025-12-14T09:04:57.221Z -INFO vmware-vmx.exe 22116 [ws@4413 threadName="vmx"] DICT floppy0.present = "FALSE"
2025-12-14T09:04:57.221Z -INFO vmware-vmx.exe 22116 [ws@4413 threadName="vmx"] DICT vmxstats.filename = "SS.scoreboard"
2025-12-14T09:04:57.221Z -INFO vmware-vmx.exe 22116 [ws@4413 threadName="vmx"] DICT guestInfo.detailed.data = <not printed>
2025-12-14T09:04:57.221Z -INFO vmware-vmx.exe 22116 [ws@4413 threadName="vmx"] DICT gui.lastPoweredViewMode = "fullscreen"
2025-12-14T09:04:57.221Z -INFO vmware-vmx.exe 22116 [ws@4413 threadName="vmx"] DICT vm.genid = "-9098097251940858075"
2025-12-14T09:04:57.221Z -INFO vmware-vmx.exe 22116 [ws@4413 threadName="vmx"] DICT vm.genidX = "7111896948152490010"
2025-12-14T09:04:57.221Z -INFO vmware-vmx.exe 22116 [ws@4413 threadName="vmx"] DICT cleanShutdown = "FALSE"
2025-12-14T09:04:57.221Z -INFO vmware-vmx.exe 22116 [ws@4413 threadName="vmx"] DICT tools.capability.verifiedSamlToken = "TRUE"
2025-12-14T09:04:57.221Z -INFO vmware-vmx.exe 22116 [ws@4413 threadName="vmx"] DICT sound.fileName = "Headset Earphone (Logitech Mono"
2025-12-14T09:04:57.221Z -INFO vmware-vmx.exe 22116 [ws@4413 threadName="vmx"] DICT sata0:1.startConnected = "FALSE"
2025-12-14T09:04:57.221Z -INFO vmware-vmx.exe 22116 [ws@4413 threadName="vmx"] DICT checkpoint.vmState = ""
2025-12-14T09:04:57.221Z -INFO vmware-vmx.exe 22116 [ws@4413 threadName="vmx"] DICT gui.stretchGuestMode = "fullfill"
2025-12-14T09:04:57.221Z -INFO vmware-vmx.exe 22116 [ws@4413 threadName="vmx"] DICT unity.wasCapable = "TRUE"
2025-12-14T09:04:57.221Z -INFO vmware-vmx.exe 22116 [ws@4413 threadName="vmx"] DICT usb_xhci:4.present = "TRUE"
2025-12-14T09:04:57.221Z -INFO vmware-vmx.exe 22116 [ws@4413 threadName="vmx"] DICT usb_xhci:4.deviceType = "hid"
2025-12-14T09:04:57.221Z -INFO vmware-vmx.exe 22116 [ws@4413 threadName="vmx"] DICT usb_xhci:4.port = "4"
2025-12-14T09:04:57.221Z -INFO vmware-vmx.exe 22116 [ws@4413 threadName="vmx"] DICT usb_xhci:4.parent = "-1"
2025-12-14T09:04:57.221Z -INFO vmware-vmx.exe 22116 [ws@4413 threadName="vmx"] DICT --- USER DEFAULTS C:\Users\mb\AppData\Roaming\VMware\config.ini
2025-12-14T09:04:57.221Z -INFO vmware-vmx.exe 22116 [ws@4413 threadName="vmx"] DICT --- HOST DEFAULTS C:\ProgramData\VMware\VMware Workstation\config.ini
2025-12-14T09:04:57.221Z -INFO vmware-vmx.exe 22116 [ws@4413 threadName="vmx"] DICT authd.client.port = "903"
2025-12-14T09:04:57.221Z -INFO vmware-vmx.exe 22116 [ws@4413 threadName="vmx"] DICT authd.proxy.nfc = "vmware-hostd:ha-nfc"
2025-12-14T09:04:57.221Z -INFO vmware-vmx.exe 22116 [ws@4413 threadName="vmx"] DICT installerDefaults.autoSoftwareUpdateEnabled = "no"
2025-12-14T09:04:57.221Z -INFO vmware-vmx.exe 22116 [ws@4413 threadName="vmx"] DICT installerDefaults.autoSoftwareUpdateEnabled.epoch = "24049"
2025-12-14T09:04:57.221Z -INFO vmware-vmx.exe 22116 [ws@4413 threadName="vmx"] DICT installerDefaults.componentDownloadEnabled = "yes"
2025-12-14T09:04:57.221Z -INFO vmware-vmx.exe 22116 [ws@4413 threadName="vmx"] DICT installerDefaults.dataCollectionEnabled = "no"
2025-12-14T09:04:57.221Z -INFO vmware-vmx.exe 22116 [ws@4413 threadName="vmx"] DICT installerDefaults.dataCollectionEnabled.epoch = "24049"
2025-12-14T09:04:57.221Z -INFO vmware-vmx.exe 22116 [ws@4413 threadName="vmx"] DICT --- SITE DEFAULTS C:\ProgramData\VMware\VMware Workstation\config.ini
2025-12-14T09:04:57.221Z -INFO vmware-vmx.exe 22116 [ws@4413 threadName="vmx"] DICT authd.client.port = "903"
2025-12-14T09:04:57.221Z -INFO vmware-vmx.exe 22116 [ws@4413 threadName="vmx"] DICT authd.proxy.nfc = "vmware-hostd:ha-nfc"
2025-12-14T09:04:57.221Z -INFO vmware-vmx.exe 22116 [ws@4413 threadName="vmx"] DICT installerDefaults.autoSoftwareUpdateEnabled = "no"
2025-12-14T09:04:57.221Z -INFO vmware-vmx.exe 22116 [ws@4413 threadName="vmx"] DICT installerDefaults.autoSoftwareUpdateEnabled.epoch = "24049"
2025-12-14T09:04:57.221Z -INFO vmware-vmx.exe 22116 [ws@4413 threadName="vmx"] DICT installerDefaults.componentDownloadEnabled = "yes"
2025-12-14T09:04:57.221Z -INFO vmware-vmx.exe 22116 [ws@4413 threadName="vmx"] DICT installerDefaults.dataCollectionEnabled = "no"
2025-12-14T09:04:57.221Z -INFO vmware-vmx.exe 22116 [ws@4413 threadName="vmx"] DICT installerDefaults.dataCollectionEnabled.epoch = "24049"
2025-12-14T09:04:57.221Z -INFO vmware-vmx.exe 22116 [ws@4413 threadName="vmx"] DICT --- GLOBAL SETTINGS C:\ProgramData\VMware\VMware Workstation\settings.ini
2025-12-14T09:04:57.221Z -INFO vmware-vmx.exe 22116 [ws@4413 threadName="vmx"] DICT printers.enabled = "FALSE"
2025-12-14T09:04:57.222Z -INFO vmware-vmx.exe 22116 [ws@4413 threadName="vmx"] Powering on guestOS 'windows9-64' using the configuration for 'windows9-64'.
2025-12-14T09:04:57.222Z -INFO vmware-vmx.exe 22116 [ws@4413 threadName="vmx"] ToolsISO: open of C:\Program Files (x86)\VMware\VMware Workstation\isoimages_manifest.txt.sig failed: Could not find the file
2025-12-14T09:04:57.222Z -INFO vmware-vmx.exe 22116 [ws@4413 threadName="vmx"] ToolsISO: Unable to read signature file 'C:\Program Files (x86)\VMware\VMware Workstation\isoimages_manifest.txt.sig', ignoring.
2025-12-14T09:04:57.223Z -INFO vmware-vmx.exe 22116 [ws@4413 threadName="vmx"] ToolsISO: Updated cached value for imageName to 'windows.iso'.
2025-12-14T09:04:57.223Z -INFO vmware-vmx.exe 22116 [ws@4413 threadName="vmx"] ToolsISO: Selected Tools ISO 'windows.iso' for 'windows9-64' guest.
2025-12-14T09:04:57.223Z -INFO vmware-vmx.exe 22116 [ws@4413 threadName="vmx"] Vix: [mainDispatch.c:4172]: VMAutomation_ReportPowerOpFinished: statevar=1, newAppState=1873, success=1 additionalError=0
2025-12-14T09:04:57.224Z -INFO vmware-vmx.exe 22116 [ws@4413 threadName="vmx"] Monitor Mode: CPL0
2025-12-14T09:04:57.225Z -INFO vmware-vmx.exe 22116 [ws@4413 threadName="vmx"] FeatureCompat: No EVC masks.
2025-12-14T09:04:57.239Z -INFO vmware-vmx.exe 22116 [ws@4413 threadName="vmx"] OvhdMem_PowerOn: initial admission: paged 1330494 nonpaged 6741 anonymous 10098
2025-12-14T09:04:57.239Z -INFO vmware-vmx.exe 22116 [ws@4413 threadName="vmx"] VMMEM: Initial Reservation: 5263MB (MainMem=6144MB)
2025-12-14T09:04:57.239Z -INFO vmware-vmx.exe 22116 [ws@4413 threadName="vmx"] numa: Reusing virtual NUMA topology numa.autosize.vcpu.maxPerVirtualNode=2 vcpus per node.
2025-12-14T09:04:57.239Z -INFO vmware-vmx.exe 22116 [ws@4413 threadName="vmx"] llc: maximum vcpus per LLC: 1
2025-12-14T09:04:57.239Z -INFO vmware-vmx.exe 22116 [ws@4413 threadName="vmx"] llc: vLLC size: 2
2025-12-14T09:04:57.241Z -INFO vmware-vmx.exe 22116 [ws@4413 threadName="vmx"] MemSched_PowerOn: balloon minGuestSize 419430 (80% of min required size 524288)
2025-12-14T09:04:57.241Z -INFO vmware-vmx.exe 22116 [ws@4413 threadName="vmx"] MemSched: reserved mem (in MB) min 128 max 28409 recommended 28409
2025-12-14T09:04:57.241Z -INFO vmware-vmx.exe 22116 [ws@4413 threadName="vmx"] MemSched: pg 1330494 np 6741 anon 10098 mem 1572864
2025-12-14T09:04:57.305Z -INFO vmware-vmx.exe 22116 [ws@4413 threadName="vmx"] MemSched: numvm 1 locked pages: num 0 max 7264512
2025-12-14T09:04:57.305Z -INFO vmware-vmx.exe 22116 [ws@4413 threadName="vmx"] MemSched: locked Page Limit: host 7650590 config 7272704
2025-12-14T09:04:57.305Z -INFO vmware-vmx.exe 22116 [ws@4413 threadName="vmx"] MemSched: minmempct 50 minalloc 0 admitted 1
2025-12-14T09:04:57.306Z -INFO vmware-vmx.exe 22116 [ws@4413 threadName="PowerNotifyThread"] VTHREAD 3164 "PowerNotifyThread"
2025-12-14T09:04:57.306Z -INFO vmware-vmx.exe 22116 [ws@4413 threadName="PowerNotifyThread"] PowerNotify thread is alive.
2025-12-14T09:04:57.306Z -INFO vmware-vmx.exe 22116 [ws@4413 threadName="vmx"] LICENSE: Running unlicensed VMX (VMware Workstation)
2025-12-14T09:04:57.306Z -INFO vmware-vmx.exe 22116 [ws@4413 threadName="vthread-21696"] VTHREAD 21696 "vthread-21696"
2025-12-14T09:04:57.307Z -INFO vmware-vmx.exe 22116 [ws@4413 threadName="vmx"] Win32U_GetFileAttributes: GetFileAttributesExW("D:\VM\mb\mb.vmpl", ...) failed, error: 2
2025-12-14T09:04:57.307Z -INFO vmware-vmx.exe 22116 [ws@4413 threadName="vmx"] PolicyVMXFindPolicyKey: policy file does not exist.
2025-12-14T09:04:57.307Z -INFO vmware-vmx.exe 22116 [ws@4413 threadName="vmx"] Win32U_GetFileAttributes: GetFileAttributesExW("D:\VM\mb\mb.vmpl", ...) failed, error: 2
2025-12-14T09:04:57.307Z -INFO vmware-vmx.exe 22116 [ws@4413 threadName="vmx"] PolicyVMXFindPolicyKey: policy file does not exist.
2025-12-14T09:04:57.307Z -INFO vmware-vmx.exe 22116 [ws@4413 threadName="vmx"] Host PA size: 39 bits. Guest PA size: 43 bits.
2025-12-14T09:04:57.308Z -INFO vmware-vmx.exe 22116 [ws@4413 threadName="vmx"] ToolsISO: Refreshing imageName for 'windows9-64' (refreshCount=1, lastCount=1).
2025-12-14T09:04:57.309Z -INFO vmware-vmx.exe 22116 [ws@4413 threadName="vmx"] ToolsISO: open of C:\Program Files (x86)\VMware\VMware Workstation\isoimages_manifest.txt.sig failed: Could not find the file
2025-12-14T09:04:57.309Z -INFO vmware-vmx.exe 22116 [ws@4413 threadName="vmx"] ToolsISO: Unable to read signature file 'C:\Program Files (x86)\VMware\VMware Workstation\isoimages_manifest.txt.sig', ignoring.
2025-12-14T09:04:57.309Z -INFO vmware-vmx.exe 22116 [ws@4413 threadName="vmx"] ToolsISO: Updated cached value for imageName to 'windows.iso'.
2025-12-14T09:04:57.309Z -INFO vmware-vmx.exe 22116 [ws@4413 threadName="vmx"] ToolsISO: Selected Tools ISO 'windows.iso' for 'windows9-64' guest.
2025-12-14T09:04:57.310Z -INFO vmware-vmx.exe 22116 [ws@4413 threadName="deviceThread"] VTHREAD 22504 "deviceThread"
2025-12-14T09:04:57.310Z -INFO vmware-vmx.exe 22116 [ws@4413 threadName="deviceThread"] Device thread is alive
2025-12-14T09:04:57.310Z -INFO vmware-vmx.exe 22116 [ws@4413 threadName="vmx"] Host VT-x Capabilities:
2025-12-14T09:04:57.310Z -INFO vmware-vmx.exe 22116 [ws@4413 threadName="vmx"] Basic VMX Information (0x00da040000000004)
2025-12-14T09:04:57.310Z -INFO vmware-vmx.exe 22116 [ws@4413 threadName="vmx"] VMCS revision ID 4
2025-12-14T09:04:57.310Z -INFO vmware-vmx.exe 22116 [ws@4413 threadName="vmx"] VMCS region length 1024
2025-12-14T09:04:57.310Z -INFO vmware-vmx.exe 22116 [ws@4413 threadName="vmx"] VMX physical-address width natural
2025-12-14T09:04:57.310Z -INFO vmware-vmx.exe 22116 [ws@4413 threadName="vmx"] SMM dual-monitor mode yes
2025-12-14T09:04:57.310Z -INFO vmware-vmx.exe 22116 [ws@4413 threadName="vmx"] VMCS memory type WB
2025-12-14T09:04:57.310Z -INFO vmware-vmx.exe 22116 [ws@4413 threadName="vmx"] Advanced INS/OUTS info yes
2025-12-14T09:04:57.310Z -INFO vmware-vmx.exe 22116 [ws@4413 threadName="vmx"] True VMX MSRs yes
2025-12-14T09:04:57.310Z -INFO vmware-vmx.exe 22116 [ws@4413 threadName="vmx"] Exception Injection ignores error code no
2025-12-14T09:04:57.310Z -INFO vmware-vmx.exe 22116 [ws@4413 threadName="vmx"] True Pin-Based VM-Execution Controls (0x0000007f00000016)
2025-12-14T09:04:57.310Z -INFO vmware-vmx.exe 22116 [ws@4413 threadName="vmx"] External-interrupt exiting {0,1}
2025-12-14T09:04:57.310Z -INFO vmware-vmx.exe 22116 [ws@4413 threadName="vmx"] NMI exiting {0,1}
2025-12-14T09:04:57.310Z -INFO vmware-vmx.exe 22116 [ws@4413 threadName="vmx"] Virtual NMIs {0,1}
2025-12-14T09:04:57.310Z -INFO vmware-vmx.exe 22116 [ws@4413 threadName="vmx"] Activate VMX-preemption timer {0,1}
2025-12-14T09:04:57.310Z -INFO vmware-vmx.exe 22116 [ws@4413 threadName="vmx"] Process posted interrupts { 0 }
2025-12-14T09:04:57.310Z -INFO vmware-vmx.exe 22116 [ws@4413 threadName="vmx"] True Primary Processor-Based VM-Execution Controls (0xfff9fffe04006172)
2025-12-14T09:04:57.310Z -INFO vmware-vmx.exe 22116 [ws@4413 threadName="vmx"] Interrupt-window exiting {0,1}
2025-12-14T09:04:57.310Z -INFO vmware-vmx.exe 22116 [ws@4413 threadName="vmx"] Use TSC offsetting {0,1}
2025-12-14T09:04:57.310Z -INFO vmware-vmx.exe 22116 [ws@4413 threadName="vmx"] HLT exiting {0,1}
2025-12-14T09:04:57.310Z -INFO vmware-vmx.exe 22116 [ws@4413 threadName="vmx"] INVLPG exiting {0,1}
2025-12-14T09:04:57.310Z -INFO vmware-vmx.exe 22116 [ws@4413 threadName="vmx"] MWAIT exiting {0,1}
2025-12-14T09:04:57.310Z -INFO vmware-vmx.exe 22116 [ws@4413 threadName="vmx"] RDPMC exiting {0,1}
2025-12-14T09:04:57.310Z -INFO vmware-vmx.exe 22116 [ws@4413 threadName="vmx"] RDTSC exiting {0,1}
2025-12-14T09:04:57.310Z -INFO vmware-vmx.exe 22116 [ws@4413 threadName="vmx"] CR3-load exiting {0,1}
2025-12-14T09:04:57.310Z -INFO vmware-vmx.exe 22116 [ws@4413 threadName="vmx"] CR3-store exiting {0,1}
2025-12-14T09:04:57.310Z -INFO vmware-vmx.exe 22116 [ws@4413 threadName="vmx"] Activate tertiary controls { 0 }
2025-12-14T09:04:57.310Z -INFO vmware-vmx.exe 22116 [ws@4413 threadName="vmx"] CR8-load exiting {0,1}
2025-12-14T09:04:57.310Z -INFO vmware-vmx.exe 22116 [ws@4413 threadName="vmx"] CR8-store exiting {0,1}
2025-12-14T09:04:57.310Z -INFO vmware-vmx.exe 22116 [ws@4413 threadName="vmx"] Use TPR shadow {0,1}
2025-12-14T09:04:57.310Z -INFO vmware-vmx.exe 22116 [ws@4413 threadName="vmx"] NMI-window exiting {0,1}
2025-12-14T09:04:57.310Z -INFO vmware-vmx.exe 22116 [ws@4413 threadName="vmx"] MOV-DR exiting {0,1}
2025-12-14T09:04:57.310Z -INFO vmware-vmx.exe 22116 [ws@4413 threadName="vmx"] Unconditional I/O exiting {0,1}
2025-12-14T09:04:57.310Z -INFO vmware-vmx.exe 22116 [ws@4413 threadName="vmx"] Use I/O bitmaps {0,1}
2025-12-14T09:04:57.310Z -INFO vmware-vmx.exe 22116 [ws@4413 threadName="vmx"] Monitor trap flag {0,1}
2025-12-14T09:04:57.310Z -INFO vmware-vmx.exe 22116 [ws@4413 threadName="vmx"] Use MSR bitmaps {0,1}
2025-12-14T09:04:57.310Z -INFO vmware-vmx.exe 22116 [ws@4413 threadName="vmx"] MONITOR exiting {0,1}
2025-12-14T09:04:57.310Z -INFO vmware-vmx.exe 22116 [ws@4413 threadName="vmx"] PAUSE exiting {0,1}
2025-12-14T09:04:57.310Z -INFO vmware-vmx.exe 22116 [ws@4413 threadName="vmx"] Activate secondary controls {0,1}
2025-12-14T09:04:57.310Z -INFO vmware-vmx.exe 22116 [ws@4413 threadName="vmx"] Secondary Processor-Based VM-Execution Controls (0x005ffcff00000000)
2025-12-14T09:04:57.310Z -INFO vmware-vmx.exe 22116 [ws@4413 threadName="vmx"] Virtualize APIC accesses {0,1}
2025-12-14T09:04:57.310Z -INFO vmware-vmx.exe 22116 [ws@4413 threadName="vmx"] Enable EPT {0,1}
2025-12-14T09:04:57.310Z -INFO vmware-vmx.exe 22116 [ws@4413 threadName="vmx"] Descriptor-table exiting {0,1}
2025-12-14T09:04:57.310Z -INFO vmware-vmx.exe 22116 [ws@4413 threadName="vmx"] Enable RDTSCP {0,1}
2025-12-14T09:04:57.310Z -INFO vmware-vmx.exe 22116 [ws@4413 threadName="vmx"] Virtualize x2APIC mode {0,1}
2025-12-14T09:04:57.310Z -INFO vmware-vmx.exe 22116 [ws@4413 threadName="vmx"] Enable VPID {0,1}
2025-12-14T09:04:57.310Z -INFO vmware-vmx.exe 22116 [ws@4413 threadName="vmx"] WBINVD exiting {0,1}
2025-12-14T09:04:57.310Z -INFO vmware-vmx.exe 22116 [ws@4413 threadName="vmx"] Unrestricted guest {0,1}
2025-12-14T09:04:57.310Z -INFO vmware-vmx.exe 22116 [ws@4413 threadName="vmx"] APIC-register virtualization { 0 }
2025-12-14T09:04:57.310Z -INFO vmware-vmx.exe 22116 [ws@4413 threadName="vmx"] Virtual-interrupt delivery { 0 }
2025-12-14T09:04:57.310Z -INFO vmware-vmx.exe 22116 [ws@4413 threadName="vmx"] PAUSE-loop exiting {0,1}
2025-12-14T09:04:57.310Z -INFO vmware-vmx.exe 22116 [ws@4413 threadName="vmx"] RDRAND exiting {0,1}
2025-12-14T09:04:57.310Z -INFO vmware-vmx.exe 22116 [ws@4413 threadName="vmx"] Enable INVPCID {0,1}
2025-12-14T09:04:57.310Z -INFO vmware-vmx.exe 22116 [ws@4413 threadName="vmx"] Enable VM Functions {0,1}
2025-12-14T09:04:57.310Z -INFO vmware-vmx.exe 22116 [ws@4413 threadName="vmx"] Use VMCS shadowing {0,1}
2025-12-14T09:04:57.310Z -INFO vmware-vmx.exe 22116 [ws@4413 threadName="vmx"] ENCLS exiting {0,1}
2025-12-14T09:04:57.310Z -INFO vmware-vmx.exe 22116 [ws@4413 threadName="vmx"] RDSEED exiting {0,1}
2025-12-14T09:04:57.310Z -INFO vmware-vmx.exe 22116 [ws@4413 threadName="vmx"] Enable PML {0,1}
2025-12-14T09:04:57.310Z -INFO vmware-vmx.exe 22116 [ws@4413 threadName="vmx"] EPT-violation #VE {0,1}
2025-12-14T09:04:57.310Z -INFO vmware-vmx.exe 22116 [ws@4413 threadName="vmx"] Conceal VMX from PT {0,1}
2025-12-14T09:04:57.310Z -INFO vmware-vmx.exe 22116 [ws@4413 threadName="vmx"] Enable XSAVES/XRSTORS {0,1}
2025-12-14T09:04:57.310Z -INFO vmware-vmx.exe 22116 [ws@4413 threadName="vmx"] PASID translation { 0 }
2025-12-14T09:04:57.310Z -INFO vmware-vmx.exe 22116 [ws@4413 threadName="vmx"] Mode-based execute control for EPT {0,1}
2025-12-14T09:04:57.310Z -INFO vmware-vmx.exe 22116 [ws@4413 threadName="vmx"] Sub-page write permissions for EPT { 0 }
2025-12-14T09:04:57.310Z -INFO vmware-vmx.exe 22116 [ws@4413 threadName="vmx"] PT uses guest physical addresses { 0 }
2025-12-14T09:04:57.310Z -INFO vmware-vmx.exe 22116 [ws@4413 threadName="vmx"] Use TSC scaling { 0 }
2025-12-14T09:04:57.310Z -INFO vmware-vmx.exe 22116 [ws@4413 threadName="vmx"] Enable UMWAIT and TPAUSE { 0 }
2025-12-14T09:04:57.310Z -INFO vmware-vmx.exe 22116 [ws@4413 threadName="vmx"] Enable ENCLV in VMX non-root mode { 0 }
2025-12-14T09:04:57.310Z -INFO vmware-vmx.exe 22116 [ws@4413 threadName="vmx"] Enable EPC Virtualization Extensions { 0 }
2025-12-14T09:04:57.310Z -INFO vmware-vmx.exe 22116 [ws@4413 threadName="vmx"] Bus lock exiting { 0 }
2025-12-14T09:04:57.310Z -INFO vmware-vmx.exe 22116 [ws@4413 threadName="vmx"] Notification VM exits { 0 }
2025-12-14T09:04:57.310Z -INFO vmware-vmx.exe 22116 [ws@4413 threadName="vmx"] Tertiary Processor-Based VM-Execution Controls (0x0000000000000000)
2025-12-14T09:04:57.310Z -INFO vmware-vmx.exe 22116 [ws@4413 threadName="vmx"] LOADIWKEY exiting no
2025-12-14T09:04:57.310Z -INFO vmware-vmx.exe 22116 [ws@4413 threadName="vmx"] Enable HLAT no
2025-12-14T09:04:57.310Z -INFO vmware-vmx.exe 22116 [ws@4413 threadName="vmx"] Enable Paging-Write no
2025-12-14T09:04:57.310Z -INFO vmware-vmx.exe 22116 [ws@4413 threadName="vmx"] Enable Guest Paging Verification no
2025-12-14T09:04:57.310Z -INFO vmware-vmx.exe 22116 [ws@4413 threadName="vmx"] Enable IPI Virtualization no
2025-12-14T09:04:57.310Z -INFO vmware-vmx.exe 22116 [ws@4413 threadName="vmx"] TD shared bit position for 5-level EPT no
2025-12-14T09:04:57.310Z -INFO vmware-vmx.exe 22116 [ws@4413 threadName="vmx"] Enable RDMSRLIST/WRMSRLIST no
2025-12-14T09:04:57.310Z -INFO vmware-vmx.exe 22116 [ws@4413 threadName="vmx"] Enable Virtual MSR_SPEC_CTRL no
2025-12-14T09:04:57.310Z -INFO vmware-vmx.exe 22116 [ws@4413 threadName="vmx"] True VM-Exit Controls (0x01ffffff00036dfb)
2025-12-14T09:04:57.310Z -INFO vmware-vmx.exe 22116 [ws@4413 threadName="vmx"] Save debug controls {0,1}
2025-12-14T09:04:57.310Z -INFO vmware-vmx.exe 22116 [ws@4413 threadName="vmx"] Host address-space size {0,1}
2025-12-14T09:04:57.310Z -INFO vmware-vmx.exe 22116 [ws@4413 threadName="vmx"] Load IA32_PERF_GLOBAL_CTRL {0,1}
2025-12-14T09:04:57.311Z -INFO vmware-vmx.exe 22116 [ws@4413 threadName="vmx"] Acknowledge interrupt on exit {0,1}
2025-12-14T09:04:57.311Z -INFO vmware-vmx.exe 22116 [ws@4413 threadName="vmx"] Save IA32_PAT {0,1}
2025-12-14T09:04:57.311Z -INFO vmware-vmx.exe 22116 [ws@4413 threadName="vmx"] Load IA32_PAT {0,1}
2025-12-14T09:04:57.311Z -INFO vmware-vmx.exe 22116 [ws@4413 threadName="vmx"] Save IA32_EFER {0,1}
2025-12-14T09:04:57.311Z -INFO vmware-vmx.exe 22116 [ws@4413 threadName="vmx"] Load IA32_EFER {0,1}
2025-12-14T09:04:57.311Z -INFO vmware-vmx.exe 22116 [ws@4413 threadName="vmx"] Save VMX-preemption timer {0,1}
2025-12-14T09:04:57.311Z -INFO vmware-vmx.exe 22116 [ws@4413 threadName="vmx"] Clear IA32_BNDCFGS {0,1}
2025-12-14T09:04:57.311Z -INFO vmware-vmx.exe 22116 [ws@4413 threadName="vmx"] Conceal VMX from processor trace {0,1}
2025-12-14T09:04:57.311Z -INFO vmware-vmx.exe 22116 [ws@4413 threadName="vmx"] Clear IA32_RTIT MSR { 0 }
2025-12-14T09:04:57.311Z -INFO vmware-vmx.exe 22116 [ws@4413 threadName="vmx"] Clear IA32_LBR_CTL MSR { 0 }
2025-12-14T09:04:57.311Z -INFO vmware-vmx.exe 22116 [ws@4413 threadName="vmx"] Clear user-interrupt notification vector { 0 }
2025-12-14T09:04:57.311Z -INFO vmware-vmx.exe 22116 [ws@4413 threadName="vmx"] Load CET state { 0 }
2025-12-14T09:04:57.311Z -INFO vmware-vmx.exe 22116 [ws@4413 threadName="vmx"] Load PKRS { 0 }
2025-12-14T09:04:57.311Z -INFO vmware-vmx.exe 22116 [ws@4413 threadName="vmx"] Save IA32_PERF_GLOBAL_CTRL { 0 }
2025-12-14T09:04:57.311Z -INFO vmware-vmx.exe 22116 [ws@4413 threadName="vmx"] Use Secondary VM-Exit Controls { 0 }
2025-12-14T09:04:57.311Z -INFO vmware-vmx.exe 22116 [ws@4413 threadName="vmx"] Secondary VM-Exit Controls (0x0000000000000000)
2025-12-14T09:04:57.311Z -INFO vmware-vmx.exe 22116 [ws@4413 threadName="vmx"] Fractured Shadow-Stack Update Reporting no
2025-12-14T09:04:57.311Z -INFO vmware-vmx.exe 22116 [ws@4413 threadName="vmx"] True VM-Entry Controls (0x0003ffff000011fb)
2025-12-14T09:04:57.311Z -INFO vmware-vmx.exe 22116 [ws@4413 threadName="vmx"] Load debug controls {0,1}
2025-12-14T09:04:57.311Z -INFO vmware-vmx.exe 22116 [ws@4413 threadName="vmx"] IA-32e mode guest {0,1}
2025-12-14T09:04:57.311Z -INFO vmware-vmx.exe 22116 [ws@4413 threadName="vmx"] Entry to SMM {0,1}
2025-12-14T09:04:57.311Z -INFO vmware-vmx.exe 22116 [ws@4413 threadName="vmx"] Deactivate dual-monitor mode {0,1}
2025-12-14T09:04:57.311Z -INFO vmware-vmx.exe 22116 [ws@4413 threadName="vmx"] Load IA32_PERF_GLOBAL_CTRL {0,1}
2025-12-14T09:04:57.311Z -INFO vmware-vmx.exe 22116 [ws@4413 threadName="vmx"] Load IA32_PAT {0,1}
2025-12-14T09:04:57.311Z -INFO vmware-vmx.exe 22116 [ws@4413 threadName="vmx"] Load IA32_EFER {0,1}
2025-12-14T09:04:57.311Z -INFO vmware-vmx.exe 22116 [ws@4413 threadName="vmx"] Load IA32_BNDCFGS {0,1}
2025-12-14T09:04:57.311Z -INFO vmware-vmx.exe 22116 [ws@4413 threadName="vmx"] Conceal VMX from processor trace {0,1}
2025-12-14T09:04:57.311Z -INFO vmware-vmx.exe 22116 [ws@4413 threadName="vmx"] Load IA32_RTIT MSR { 0 }
2025-12-14T09:04:57.311Z -INFO vmware-vmx.exe 22116 [ws@4413 threadName="vmx"] Load user-interrupt notification vector { 0 }
2025-12-14T09:04:57.311Z -INFO vmware-vmx.exe 22116 [ws@4413 threadName="vmx"] Load CET state { 0 }
2025-12-14T09:04:57.311Z -INFO vmware-vmx.exe 22116 [ws@4413 threadName="vmx"] Load IA32_LBR_CTL MSR { 0 }
2025-12-14T09:04:57.311Z -INFO vmware-vmx.exe 22116 [ws@4413 threadName="vmx"] Load PKRS { 0 }
2025-12-14T09:04:57.311Z -INFO vmware-vmx.exe 22116 [ws@4413 threadName="vmx"] VPID and EPT Capabilities (0x00000f0106734141)
2025-12-14T09:04:57.311Z -INFO vmware-vmx.exe 22116 [ws@4413 threadName="vmx"] R=0/W=0/X=1 yes
2025-12-14T09:04:57.311Z -INFO vmware-vmx.exe 22116 [ws@4413 threadName="vmx"] Page-walk length 3 yes
2025-12-14T09:04:57.311Z -INFO vmware-vmx.exe 22116 [ws@4413 threadName="vmx"] EPT memory type WB yes
2025-12-14T09:04:57.311Z -INFO vmware-vmx.exe 22116 [ws@4413 threadName="vmx"] 2MB super-page yes
2025-12-14T09:04:57.311Z -INFO vmware-vmx.exe 22116 [ws@4413 threadName="vmx"] 1GB super-page yes
2025-12-14T09:04:57.311Z -INFO vmware-vmx.exe 22116 [ws@4413 threadName="vmx"] INVEPT support yes
2025-12-14T09:04:57.311Z -INFO vmware-vmx.exe 22116 [ws@4413 threadName="vmx"] Access & Dirty Bits yes
2025-12-14T09:04:57.311Z -INFO vmware-vmx.exe 22116 [ws@4413 threadName="vmx"] Advanced VM exit information for EPT violations yes
2025-12-14T09:04:57.311Z -INFO vmware-vmx.exe 22116 [ws@4413 threadName="vmx"] Supervisor shadow-stack control no
2025-12-14T09:04:57.311Z -INFO vmware-vmx.exe 22116 [ws@4413 threadName="vmx"] Type 1 INVEPT yes
2025-12-14T09:04:57.311Z -INFO vmware-vmx.exe 22116 [ws@4413 threadName="vmx"] Type 2 INVEPT yes
2025-12-14T09:04:57.311Z -INFO vmware-vmx.exe 22116 [ws@4413 threadName="vmx"] INVVPID support yes
2025-12-14T09:04:57.311Z -INFO vmware-vmx.exe 22116 [ws@4413 threadName="vmx"] Type 0 INVVPID yes
2025-12-14T09:04:57.311Z -INFO vmware-vmx.exe 22116 [ws@4413 threadName="vmx"] Type 1 INVVPID yes
2025-12-14T09:04:57.311Z -INFO vmware-vmx.exe 22116 [ws@4413 threadName="vmx"] Type 2 INVVPID yes
2025-12-14T09:04:57.311Z -INFO vmware-vmx.exe 22116 [ws@4413 threadName="vmx"] Type 3 INVVPID yes
2025-12-14T09:04:57.311Z -INFO vmware-vmx.exe 22116 [ws@4413 threadName="vmx"] Miscellaneous VMX Data (0x000000007004c1e7)
2025-12-14T09:04:57.311Z -INFO vmware-vmx.exe 22116 [ws@4413 threadName="vmx"] TSC to preemption timer ratio 7
2025-12-14T09:04:57.311Z -INFO vmware-vmx.exe 22116 [ws@4413 threadName="vmx"] VM-Exit saves EFER.LMA yes
2025-12-14T09:04:57.311Z -INFO vmware-vmx.exe 22116 [ws@4413 threadName="vmx"] Activity State HLT yes
2025-12-14T09:04:57.311Z -INFO vmware-vmx.exe 22116 [ws@4413 threadName="vmx"] Activity State shutdown yes
2025-12-14T09:04:57.311Z -INFO vmware-vmx.exe 22116 [ws@4413 threadName="vmx"] Activity State wait-for-SIPI yes
2025-12-14T09:04:57.311Z -INFO vmware-vmx.exe 22116 [ws@4413 threadName="vmx"] Processor trace in VMX yes
2025-12-14T09:04:57.311Z -INFO vmware-vmx.exe 22116 [ws@4413 threadName="vmx"] RDMSR SMBASE MSR in SMM yes
2025-12-14T09:04:57.311Z -INFO vmware-vmx.exe 22116 [ws@4413 threadName="vmx"] CR3 targets supported 4
2025-12-14T09:04:57.311Z -INFO vmware-vmx.exe 22116 [ws@4413 threadName="vmx"] Maximum MSR list size 512
2025-12-14T09:04:57.311Z -INFO vmware-vmx.exe 22116 [ws@4413 threadName="vmx"] VMXOFF holdoff of SMIs yes
2025-12-14T09:04:57.311Z -INFO vmware-vmx.exe 22116 [ws@4413 threadName="vmx"] Allow all VMWRITEs yes
2025-12-14T09:04:57.311Z -INFO vmware-vmx.exe 22116 [ws@4413 threadName="vmx"] Allow zero instruction length yes
2025-12-14T09:04:57.311Z -INFO vmware-vmx.exe 22116 [ws@4413 threadName="vmx"] MSEG revision ID 0
2025-12-14T09:04:57.311Z -INFO vmware-vmx.exe 22116 [ws@4413 threadName="vmx"] VMX-Fixed Bits in CR0 (0x0000000080000021/0x00000000ffffffff)
2025-12-14T09:04:57.311Z -INFO vmware-vmx.exe 22116 [ws@4413 threadName="vmx"] Fixed to 0 0xffffffff00000000
2025-12-14T09:04:57.311Z -INFO vmware-vmx.exe 22116 [ws@4413 threadName="vmx"] Fixed to 1 0x0000000080000021
2025-12-14T09:04:57.311Z -INFO vmware-vmx.exe 22116 [ws@4413 threadName="vmx"] Variable 0x000000007fffffde
2025-12-14T09:04:57.311Z -INFO vmware-vmx.exe 22116 [ws@4413 threadName="vmx"] VMX-Fixed Bits in CR4 (0x0000000000002000/0x00000000003767ff)
2025-12-14T09:04:57.311Z -INFO vmware-vmx.exe 22116 [ws@4413 threadName="vmx"] Fixed to 0 0xffffffffffc89800
2025-12-14T09:04:57.311Z -INFO vmware-vmx.exe 22116 [ws@4413 threadName="vmx"] Fixed to 1 0x0000000000002000
2025-12-14T09:04:57.311Z -INFO vmware-vmx.exe 22116 [ws@4413 threadName="vmx"] Variable 0x00000000003747ff
2025-12-14T09:04:57.311Z -INFO vmware-vmx.exe 22116 [ws@4413 threadName="vmx"] VMCS Enumeration (0x000000000000002e)
2025-12-14T09:04:57.311Z -INFO vmware-vmx.exe 22116 [ws@4413 threadName="vmx"] Highest index 0x17
2025-12-14T09:04:57.311Z -INFO vmware-vmx.exe 22116 [ws@4413 threadName="vmx"] VM Functions (0x0000000000000001)
2025-12-14T09:04:57.311Z -INFO vmware-vmx.exe 22116 [ws@4413 threadName="vmx"] Function 0 (EPTP-switching) supported.
2025-12-14T09:04:57.311Z -INFO vmware-vmx.exe 22116 [ws@4413 threadName="vmx"] Monitor_PowerOn: hostedVSMPMaxSkew is 1500 us (4788002 cycles)
2025-12-14T09:04:57.312Z -INFO vmware-vmx.exe 22116 [ws@4413 threadName="vmx"] vmm-modules: [vmm.vmm, vmce-vmce.vmm, viommu-none.vmm, vprobe-none.vmm, hv-vt.vmm, gphys-ept.vmm, callstack-none.vmm, ahci-ahci.vmm, !ahciShared=0x0, !e1000Shared=0xc00, !tdxSharedVMData=0x1480, !vmSamples=0x1480, !theIOSpace=0x14c0, !ttGPPerVcpu=0x82c0, {UseUnwind}=0x0, numVCPUsAsAddr=0x2, {SharedAreaReservations}=0x8300, {rodataSize}=0x227aa, {textAddr}=0xfffffffffc000000, {textSize}=0x93cc7, <MonSrcFile>]
2025-12-14T09:04:57.312Z -INFO vmware-vmx.exe 22116 [ws@4413 threadName="vmx"] vmm-vcpus: 2
2025-12-14T09:04:57.330Z -INFO vmware-vmx.exe 22116 [ws@4413 threadName="vmx"] KHZEstimate 3192001
2025-12-14T09:04:57.330Z -INFO vmware-vmx.exe 22116 [ws@4413 threadName="vmx"] MHZEstimate 3192
2025-12-14T09:04:57.330Z -INFO vmware-vmx.exe 22116 [ws@4413 threadName="vmx"] NumVCPUs 2
2025-12-14T09:04:57.331Z -INFO vmware-vmx.exe 22116 [ws@4413 threadName="vmx"] AIOGNRC: numThreads=17 ide=0, scsi=1, passthru=0
2025-12-14T09:04:57.331Z -INFO vmware-vmx.exe 22116 [ws@4413 threadName="vmx"] WORKER: Creating new group with maxThreads=17 (17)
2025-12-14T09:04:57.347Z -INFO vmware-vmx.exe 22116 [ws@4413 threadName="vmx"] WORKER: Creating new group with maxThreads=1 (18)
2025-12-14T09:04:57.347Z -INFO vmware-vmx.exe 22116 [ws@4413 threadName="vmx"] MainMem: CPT Host WZ=0 PF=6144 D=0
2025-12-14T09:04:57.347Z -INFO vmware-vmx.exe 22116 [ws@4413 threadName="vmx"] MainMem: CPT PLS=1 PLR=1 BS=1 BlkP=32 Mult=4 W=50
2025-12-14T09:04:57.354Z -INFO vmware-vmx.exe 22116 [ws@4413 threadName="vmx"] FILE: FileLockScanDirectory discarding M58822.lck from D:\VM\mb\564df7df-04ea-ecf6-f607-2c292385905a.vmem.lck': invalid executionID 22352-134104322089384059(vmware-vmx.exe).
2025-12-14T09:04:58.055Z -INFO vmware-vmx.exe 22116 [ws@4413 threadName="vmx"] MainMem: Opened paging file, 'D:\VM\mb\564df7df-04ea-ecf6-f607-2c292385905a.vmem'.
2025-12-14T09:04:58.055Z -NOTICE vmware-vmx.exe 22116 [ws@4413 threadName="vmx"] PowerOnTiming: Module MainMem took 723542 us
2025-12-14T09:04:58.055Z -INFO vmware-vmx.exe 22116 [ws@4413 threadName="vmx"] MStat: Creating Stat vm.uptime
2025-12-14T09:04:58.055Z -INFO vmware-vmx.exe 22116 [ws@4413 threadName="vmx"] MStat: Creating Stat vm.suspendTime
2025-12-14T09:04:58.055Z -INFO vmware-vmx.exe 22116 [ws@4413 threadName="vmx"] MStat: Creating Stat vm.powerOnTimeStamp
2025-12-14T09:04:58.056Z -INFO vmware-vmx.exe 22116 [ws@4413 threadName="aioCompletion"] VTHREAD 22112 "aioCompletion"
2025-12-14T09:04:58.056Z -INFO vmware-vmx.exe 22116 [ws@4413 threadName="vmx"] VMXAIOMGR: Using: simple=Compl
2025-12-14T09:04:58.061Z -INFO vmware-vmx.exe 22116 [ws@4413 threadName="vmx"] WORKER: Creating new group with maxThreads=1 (19)
2025-12-14T09:04:58.065Z -INFO vmware-vmx.exe 22116 [ws@4413 threadName="vmx"] WORKER: Creating new group with maxThreads=1 (20)
2025-12-14T09:04:58.065Z -INFO vmware-vmx.exe 22116 [ws@4413 threadName="vmx"] WORKER: Creating new group with maxThreads=14 (34)
2025-12-14T09:04:58.065Z -INFO vmware-vmx.exe 22116 [ws@4413 threadName="vmx"] FeatureCompat: No VM masks.
2025-12-14T09:04:58.065Z -INFO vmware-vmx.exe 22116 [ws@4413 threadName="vmx"] TimeTracker host to guest rate conversion 2981805295 @ 3192001000Hz -> 0 @ 3192001000Hz
2025-12-14T09:04:58.065Z -INFO vmware-vmx.exe 22116 [ws@4413 threadName="vmx"] TimeTracker host to guest rate conversion ((x * 2147483648) >> 31) + -2981805295
2025-12-14T09:04:58.065Z -INFO vmware-vmx.exe 22116 [ws@4413 threadName="vmx"] Disabling TSC scaling since host does not support it.
2025-12-14T09:04:58.065Z -INFO vmware-vmx.exe 22116 [ws@4413 threadName="vmx"] TSC offsetting enabled.
2025-12-14T09:04:58.065Z -INFO vmware-vmx.exe 22116 [ws@4413 threadName="vmx"] timeTracker.globalProgressMaxAllowanceMS: 2000
2025-12-14T09:04:58.065Z -INFO vmware-vmx.exe 22116 [ws@4413 threadName="vmx"] timeTracker.globalProgressToAllowanceNS: 1000
2025-12-14T09:04:58.065Z -INFO vmware-vmx.exe 22116 [ws@4413 threadName="vmx"] MKS PowerOn
2025-12-14T09:04:58.067Z -INFO vmware-vmx.exe 22116 [ws@4413 threadName="mks"] VTHREAD 18700 "mks"
2025-12-14T09:04:58.067Z -INFO vmware-vmx.exe 22116 [ws@4413 threadName="mks"] MKS thread is alive
2025-12-14T09:04:58.067Z -INFO vmware-vmx.exe 22116 [ws@4413 threadName="svga"] VTHREAD 18192 "svga"
2025-12-14T09:04:58.067Z -INFO vmware-vmx.exe 22116 [ws@4413 threadName="svga"] SVGA thread is alive
2025-12-14T09:04:58.067Z -INFO vmware-vmx.exe 22116 [ws@4413 threadName="mks"] MKS: SSE2=1, SSSE3=1, SSE4_1=1
2025-12-14T09:04:58.068Z -INFO vmware-vmx.exe 22116 [ws@4413 threadName="mouse"] VTHREAD 18664 "mouse"
2025-12-14T09:04:58.068Z -INFO vmware-vmx.exe 22116 [ws@4413 threadName="mks"] MKS-HookKeyboard: RegQueryValueEx(LowLevelHooksTimeout) failed: The system cannot find the file specified (2)
2025-12-14T09:04:58.068Z -INFO vmware-vmx.exe 22116 [ws@4413 threadName="kbh"] VTHREAD 17772 "kbh"
2025-12-14T09:04:58.073Z -INFO vmware-vmx.exe 22116 [ws@4413 threadName="mks"] MKSWin32: Registering top level window (0x30a78) to receive session change notification.
2025-12-14T09:04:58.075Z -INFO vmware-vmx.exe 22116 [ws@4413 threadName="mks"] MKSWin32: Disabled power throttling.
2025-12-14T09:04:58.075Z -INFO vmware-vmx.exe 22116 [ws@4413 threadName="mks"] Current Display Settings:
2025-12-14T09:04:58.075Z -INFO vmware-vmx.exe 22116 [ws@4413 threadName="mks"] Display: 0 size: 3840x2160 position: (0, 0) name: \\.\DISPLAY1
2025-12-14T09:04:58.075Z -INFO vmware-vmx.exe 22116 [ws@4413 threadName="mks"] Display: 1 size: 1080x1920 position: (3840, 235) name: \\.\DISPLAY2
2025-12-14T09:04:58.075Z -INFO vmware-vmx.exe 22116 [ws@4413 threadName="mks"] Display: 2 size: 1920x1080 position: (-1920, 135) name: \\.\DISPLAY3
2025-12-14T09:04:58.075Z -INFO vmware-vmx.exe 22116 [ws@4413 threadName="mks"] MKSWin32: MIL: 0x4000
2025-12-14T09:04:58.075Z -INFO vmware-vmx.exe 22116 [ws@4413 threadName="mks"] MKSRenderMain: PowerOn allowed BasicOps ISB DX12 DX11 DX11Basic VK
2025-12-14T09:04:58.075Z -INFO vmware-vmx.exe 22116 [ws@4413 threadName="mks"] MKSRenderMain: ISB enabled by config
2025-12-14T09:04:58.075Z -INFO vmware-vmx.exe 22116 [ws@4413 threadName="mks"] MKSRenderMain: Collecting RenderOps caps from ISB
2025-12-14T09:04:58.075Z -INFO vmware-vmx.exe 22116 [ws@4413 threadName="mks"] MKSRenderMain: Starting ISB
2025-12-14T09:04:58.075Z -INFO vmware-vmx.exe 22116 [ws@4413 threadName="mks"] ISBRendererComm: ISBRendererComm DataChannel size=1073741824
2025-12-14T09:04:58.094Z -INFO vmware-vmx.exe 22116 [ws@4413 threadName="mks"] LocalMKS: MKS_UUID=52 7a 0e 42 c1 42 a8 d1-eb da b8 7a 6d 80 c4 39
2025-12-14T09:04:58.098Z -INFO vmware-vmx.exe 22116 [ws@4413 threadName="mks"] LogRotation: Rotating to a new log file (keepOld 3) took 0.001661 seconds.
2025-12-14T09:04:58.099Z -INFO vmware-vmx.exe 22116 [ws@4413 threadName="mks"] ISBRendererComm: mksSandbox command-line: C:\Program Files (x86)\VMware\VMware Workstation\x64\mksSandbox.exe --pipeInfo \\.\pipe\vmware\mksSandbox\mksSandbox-52 5d 9d 29 7f 4b b4 36-ba 2d 3c 64 a0 01 58 a2
2025-12-14T09:04:58.147Z -INFO vmware-vmx.exe 22116 [ws@4413 threadName="mks"] ISBRendererComm: Spawned process with handle 1856
2025-12-14T09:04:58.147Z -INFO vmware-vmx.exe 22116 [ws@4413 threadName="mks"] ISBRendererComm: Waiting for mksSandbox state 1...
2025-12-14T09:04:58.791Z -INFO vmware-vmx.exe 22116 [ws@4413 threadName="mks"] ISBRendererComm: Sandbox Renderer: DX12Renderer
2025-12-14T09:04:58.791Z -INFO vmware-vmx.exe 22116 [ws@4413 threadName="mks"] MKS: Renderer adapter luid = 0xDAFA
2025-12-14T09:04:58.791Z -WARNING vmware-vmx.exe 22116 [ws@4413 threadName="mks"] mksSandboxLog: Vulkan Renderer: VK_KHR_sampler_ycbcr_conversion extension not supported. Cannot run without it.
2025-12-14T09:04:58.791Z -WARNING vmware-vmx.exe 22116 [ws@4413 threadName="mks"] mksSandboxLog: Vulkan Renderer: Unable to start the Vulkan renderer.
2025-12-14T09:04:58.795Z -INFO vmware-vmx.exe 22116 [ws@4413 threadName="mks"] MKSRenderMain: Started ISB (DX12)
2025-12-14T09:04:58.795Z -INFO vmware-vmx.exe 22116 [ws@4413 threadName="mks"] MKSRenderMain: Found Full Renderer: ISBRenderer (DX12Renderer)
2025-12-14T09:04:58.795Z -INFO vmware-vmx.exe 22116 [ws@4413 threadName="mks"] MKSRenderMain: maxTextureSize=16384
2025-12-14T09:04:58.796Z -INFO vmware-vmx.exe 22116 [ws@4413 threadName="mks"] KHBKL: Unable to parse keystring at: ''
2025-12-14T09:04:58.796Z -INFO vmware-vmx.exe 22116 [ws@4413 threadName="mks"] MKSRemoteMgr: Set default display name: SS
2025-12-14T09:04:58.796Z -INFO vmware-vmx.exe 22116 [ws@4413 threadName="mks"] MKSRemoteMgr: Loading VNC Configuration from VM config file
2025-12-14T09:04:58.796Z -INFO vmware-vmx.exe 22116 [ws@4413 threadName="mks"] MKSRemoteMgr: Using default VNC keymap table "us"
2025-12-14T09:04:58.796Z -NOTICE vmware-vmx.exe 22116 [ws@4413 threadName="vmx"] PowerOnTiming: Module MKS took 731847 us
2025-12-14T09:04:58.797Z -INFO vmware-vmx.exe 22116 [ws@4413 threadName="vmx"] VLANCE: send cluster threshold is 80, size = 2 recalcInterval is 20000 us
2025-12-14T09:04:58.797Z -INFO vmware-vmx.exe 22116 [ws@4413 threadName="vmx"] VMXNET: send cluster threshold is 80, size = 2 recalcInterval is 20000 ticks, dontClusterSize is 128
2025-12-14T09:04:58.797Z -INFO vmware-vmx.exe 22116 [ws@4413 threadName="vmx"] Chipset version: 0x13
2025-12-14T09:04:58.799Z -INFO vmware-vmx.exe 22116 [ws@4413 threadName="vmx"] SOUNDLIB: Creating the Wave sound backend.
2025-12-14T09:04:58.804Z -NOTICE vmware-vmx.exe 22116 [ws@4413 threadName="vmx"] ConfigDB: Setting pciBridge4.pciSlotNumber = "-1"
2025-12-14T09:04:58.804Z -NOTICE vmware-vmx.exe 22116 [ws@4413 threadName="vmx"] ConfigDB: Setting pciBridge5.pciSlotNumber = "-1"
2025-12-14T09:04:58.804Z -NOTICE vmware-vmx.exe 22116 [ws@4413 threadName="vmx"] ConfigDB: Setting pciBridge6.pciSlotNumber = "-1"
2025-12-14T09:04:58.804Z -NOTICE vmware-vmx.exe 22116 [ws@4413 threadName="vmx"] ConfigDB: Setting pciBridge7.pciSlotNumber = "-1"
2025-12-14T09:04:58.805Z -NOTICE vmware-vmx.exe 22116 [ws@4413 threadName="vmx"] ConfigDB: Setting pciBridge4.pciSlotNumber = "21"
2025-12-14T09:04:58.805Z -NOTICE vmware-vmx.exe 22116 [ws@4413 threadName="vmx"] ConfigDB: Setting pciBridge5.pciSlotNumber = "22"
2025-12-14T09:04:58.805Z -NOTICE vmware-vmx.exe 22116 [ws@4413 threadName="vmx"] ConfigDB: Setting pciBridge6.pciSlotNumber = "23"
2025-12-14T09:04:58.805Z -NOTICE vmware-vmx.exe 22116 [ws@4413 threadName="vmx"] ConfigDB: Setting pciBridge7.pciSlotNumber = "24"
2025-12-14T09:04:58.819Z -INFO vmware-vmx.exe 22116 [ws@4413 threadName="vmx"] MigrateBusMemPrealloc: BusMem preallocation begins.
2025-12-14T09:04:58.819Z -INFO vmware-vmx.exe 22116 [ws@4413 threadName="vmx"] MigrateBusMemPrealloc: BusMem preallocation completes.
2025-12-14T09:04:58.819Z -NOTICE vmware-vmx.exe 22116 [ws@4413 threadName="vmx"] ConfigDB: Setting scsi0:0.redo = ""
2025-12-14T09:04:58.819Z -INFO vmware-vmx.exe 22116 [ws@4413 threadName="vmx"] DISK: OPEN scsi0:0 'D:\VM\mb\mb.vmdk' persistent R[]
2025-12-14T09:04:58.826Z -INFO vmware-vmx.exe 22116 [ws@4413 threadName="vmx"] FILE: FileLockScanDirectory discarding M04824.lck from D:\VM\mb\mb.vmdk.lck': invalid executionID 22352-134104322089384059(vmware-vmx.exe).
2025-12-14T09:04:58.850Z -ERROR vmware-vmx.exe 22116 [ws@4413 threadName="vmx"] DISKLIB-SPARSE: "D:\VM\mb\mb-s010.vmdk" : failed to open (The specified virtual disk needs repair (14)): Disk needs repair.
2025-12-14T09:04:58.852Z -ERROR vmware-vmx.exe 22116 [ws@4413 threadName="vmx"] DISKLIB-LINK : DiskLinkOpen: Failed to open 'D:\VM\mb\mb.vmdk': : The specified virtual disk needs repair
2025-12-14T09:04:58.852Z -ERROR vmware-vmx.exe 22116 [ws@4413 threadName="vmx"] DISKLIB-CHAIN : DiskChainOpen: "D:\VM\mb\mb.vmdk": failed to open: The specified virtual disk needs repair.
2025-12-14T09:04:58.852Z -INFO vmware-vmx.exe 22116 [ws@4413 threadName="vmx"] DISKLIB-LIB : Failed to open 'D:\VM\mb\mb.vmdk' with flags 0xa The specified virtual disk needs repair (14).
2025-12-14T09:04:59.005Z -INFO vmware-vmx.exe 22116 [ws@4413 threadName="vmx"] DiskGetGeometry: Reading of disk partition table
2025-12-14T09:04:59.005Z -INFO vmware-vmx.exe 22116 [ws@4413 threadName="vmx"] DISK: Disk 'D:\VM\mb\mb.vmdk' has UUID '60 00 c2 9a fa 08 2a a9-55 07 bc ab 65 85 71 57'
2025-12-14T09:04:59.005Z -INFO vmware-vmx.exe 22116 [ws@4413 threadName="vmx"] DISK: OPEN 'D:\VM\mb\mb.vmdk' Geo (5221/255/63) BIOS Geo (5221/255/63)
2025-12-14T09:04:59.010Z -INFO vmware-vmx.exe 22116 [ws@4413 threadName="vmx"] DISKUTILWIN32: DiskUtilW32IsATASSDDevice: Reported rotation rate = 0
2025-12-14T09:04:59.010Z -INFO vmware-vmx.exe 22116 [ws@4413 threadName="vmx"] DISK: Opening disks took 191 ms.
2025-12-14T09:04:59.010Z -INFO vmware-vmx.exe 22116 [ws@4413 threadName="vmx"] USBArbLib: USBArbLib initialized successfully, retryIntervalStart(5), retryIntervalMax(120), arbSocketName(\\.\pipe\vmware-usbarbpipe), useLocking(yes), tryUpgrading(no).
2025-12-14T09:04:59.010Z -INFO vmware-vmx.exe 22116 [ws@4413 threadName="vmx"] UsbEnum: Initializing UsbEnum library, disableLocking(no), allowBootableHid(yes).
2025-12-14T09:04:59.011Z -INFO vmware-vmx.exe 22116 [ws@4413 threadName="vmx"] USB: Initializing 'Virtual Hub' backend
2025-12-14T09:04:59.011Z -INFO vmware-vmx.exe 22116 [ws@4413 threadName="vmx"] USB: Initializing 'Generic' backend
2025-12-14T09:04:59.011Z -WARNING vmware-vmx.exe 22116 [ws@4413 threadName="vmx"] USBArbLib: OUT SET_AUTO_CONNECT: Not connected to arbitrator, autoconnect(0) for client 'SS', connectState(1).
2025-12-14T09:04:59.011Z -INFO vmware-vmx.exe 22116 [ws@4413 threadName="vmx"] USB: Initializing 'Virtual HID' backend
2025-12-14T09:04:59.011Z -INFO vmware-vmx.exe 22116 [ws@4413 threadName="sensorThread"] VTHREAD 9680 "sensorThread"
2025-12-14T09:04:59.011Z -INFO vmware-vmx.exe 22116 [ws@4413 threadName="vmx"] USB: Initializing 'Remote Device' backend
2025-12-14T09:04:59.011Z -INFO vmware-vmx.exe 22116 [ws@4413 threadName="vmx"] RemoteUSBVMX: Retrieved hostId [bf 27 d0 83 a7 28 49 50-f8 74 a3 9f c2 45 00 5f].
2025-12-14T09:04:59.011Z -INFO vmware-vmx.exe 22116 [ws@4413 threadName="vmx"] RemoteUSBVMX: Protocol version min:15 current:19
2025-12-14T09:04:59.011Z -INFO vmware-vmx.exe 22116 [ws@4413 threadName="vmx"] RemoteUSBVMX: no delay setting is TRUE.
2025-12-14T09:04:59.011Z -INFO vmware-vmx.exe 22116 [ws@4413 threadName="vmx"] USB: Initializing 'Virtual Mass Storage' backend
2025-12-14T09:04:59.011Z -INFO vmware-vmx.exe 22116 [ws@4413 threadName="vmx"] USB: Initializing 'Virtual CCID' backend
2025-12-14T09:04:59.011Z -INFO vmware-vmx.exe 22116 [ws@4413 threadName="vmx"] USB-CCID: Could not establish context: SCARD_E_NO_SERVICE(0x8010001d).
2025-12-14T09:04:59.013Z -INFO vmware-vmx.exe 22116 [ws@4413 threadName="vmx"] USB-CCID: Could not establish context: SCARD_E_NO_SERVICE(0x8010001d).
2025-12-14T09:04:59.013Z -INFO vmware-vmx.exe 22116 [ws@4413 threadName="usbCCIDEnumCards"] VTHREAD 4800 "usbCCIDEnumCards"
2025-12-14T09:04:59.013Z -INFO vmware-vmx.exe 22116 [ws@4413 threadName="usbCCIDEnumCards"] USB-CCID: Card enum thread created.
2025-12-14T09:04:59.013Z -INFO vmware-vmx.exe 22116 [ws@4413 threadName="vmx"] USB: Initializing 'Virtual Video' backend
2025-12-14T09:04:59.021Z -INFO vmware-vmx.exe 22116 [ws@4413 threadName="vmx"] USBGW: Skipping disk backing for path(D:\VM\mb\mb.vmx).
2025-12-14T09:04:59.022Z -INFO vmware-vmx.exe 22116 [ws@4413 threadName="vmx"] USBGW: Skipping disk backing for path(D:\VM\mb\mb.vmdk).
2025-12-14T09:04:59.022Z -INFO vmware-vmx.exe 22116 [ws@4413 threadName="vmx"] USBGW: Skipping disk backing for path(D:\VM\mb\mb.vmsd).
2025-12-14T09:04:59.022Z -INFO vmware-vmx.exe 22116 [ws@4413 threadName="vmx"] USBGW: Skipping disk backing for path(D:\VM\mb\mb.nvram).
2025-12-14T09:04:59.023Z -INFO vmware-vmx.exe 22116 [ws@4413 threadName="usbCCIDEnumCards"] USB-CCID: Could not establish context: SCARD_E_NO_SERVICE(0x8010001d).
2025-12-14T09:04:59.023Z -WARNING vmware-vmx.exe 22116 [ws@4413 threadName="vmx"] Device vide configured to use lock chains but base supportin workerlib is disabled
2025-12-14T09:04:59.024Z -INFO vmware-vmx.exe 22116 [ws@4413 threadName="vmx"] SCSI: scsi0: intr coalescing: on period=50msec cifTh=4 iopsTh=2000 hlt=0
2025-12-14T09:04:59.024Z -WARNING vmware-vmx.exe 22116 [ws@4413 threadName="vmx"] Device SCSI0 configured to use lock chains but base supportin workerlib is disabled
2025-12-14T09:04:59.024Z -INFO vmware-vmx.exe 22116 [ws@4413 threadName="vmx"] SCSI0: UNTAGGED commands will be converted to ORDER tags.
2025-12-14T09:04:59.024Z -INFO vmware-vmx.exe 22116 [ws@4413 threadName="vmx"] SCSI DEVICE (scsi0:0): Computed value of scsi0:0.useBounceBuffers: default
2025-12-14T09:04:59.024Z -INFO vmware-vmx.exe 22116 [ws@4413 threadName="vmx"] DISKUTIL: scsi0:0 : capacity=83886080 logical sector size=512
2025-12-14T09:04:59.024Z -INFO vmware-vmx.exe 22116 [ws@4413 threadName="vmx"] DISKUTIL: scsi0:0 : geometry=5221/255/63
2025-12-14T09:04:59.024Z -INFO vmware-vmx.exe 22116 [ws@4413 threadName="vmx"] SVGA-GFB: Config settings: autodetect=1, numDisplays=2, maxWidth=5120, maxHeight=3200
2025-12-14T09:04:59.024Z -INFO vmware-vmx.exe 22116 [ws@4413 threadName="vmx"] SVGA-GFB: Desired maximum display topology: wh(6688, 5016)
2025-12-14T09:04:59.024Z -INFO vmware-vmx.exe 22116 [ws@4413 threadName="vmx"] SVGA-GFB: Autodetected target framebuffer size = 268435456
2025-12-14T09:04:59.024Z -INFO vmware-vmx.exe 22116 [ws@4413 threadName="vmx"] SVGA-GFB: Autodetected target primary size = 268435456
2025-12-14T09:04:59.024Z -INFO vmware-vmx.exe 22116 [ws@4413 threadName="vmx"] SVGA-GFB: Using Initial gfbSize = 4194304
2025-12-14T09:04:59.024Z -INFO vmware-vmx.exe 22116 [ws@4413 threadName="vmx"] SVGA-GFB: MaxPrimaryMem register = 268435456
2025-12-14T09:04:59.024Z -INFO vmware-vmx.exe 22116 [ws@4413 threadName="vmx"] SVGA-GFB: Truncated maximum resolution for register modes to VRAM size: VRAM=4194304 bytes, max wh(1176, 885)
2025-12-14T09:04:59.024Z -INFO vmware-vmx.exe 22116 [ws@4413 threadName="vmx"] SVGA-GFB: Max wh(1176, 885), number of displays: 10
2025-12-14T09:04:59.024Z -INFO vmware-vmx.exe 22116 [ws@4413 threadName="vmx"] SVGA-GFB: Allocated gfbSize=4194304
2025-12-14T09:04:59.025Z -NOTICE vmware-vmx.exe 22116 [ws@4413 threadName="vmx"] ConfigDB: Setting vmotion.checkpointFBSize = "4194304"
2025-12-14T09:04:59.025Z -NOTICE vmware-vmx.exe 22116 [ws@4413 threadName="vmx"] ConfigDB: Setting vmotion.checkpointSVGAPrimarySize = "268435456"
2025-12-14T09:04:59.025Z -INFO vmware-vmx.exe 22116 [ws@4413 threadName="vmx"] SVGA: SVGA DeviceLabel: svga2
2025-12-14T09:04:59.025Z -INFO vmware-vmx.exe 22116 [ws@4413 threadName="vmx"] SVGA: mobMaxSize=134217728
2025-12-14T09:04:59.025Z -INFO vmware-vmx.exe 22116 [ws@4413 threadName="vmx"] SVGA: graphicsMemoryKB=2097152
2025-12-14T09:04:59.025Z -INFO vmware-vmx.exe 22116 [ws@4413 threadName="vmx"] SVGA: FIFO capabilities 0x0000077f
2025-12-14T09:04:59.025Z -INFO vmware-vmx.exe 22116 [ws@4413 threadName="vmx"] SVGAFeature renderer (before clamping) svga.supports3D bool 1
2025-12-14T09:04:59.025Z -INFO vmware-vmx.exe 22116 [ws@4413 threadName="vmx"] SVGAFeature renderer (before clamping) svga.baseCapsLevel num 11
2025-12-14T09:04:59.025Z -INFO vmware-vmx.exe 22116 [ws@4413 threadName="vmx"] SVGAFeature renderer (before clamping) svga.maxPointSize num 1
2025-12-14T09:04:59.025Z -INFO vmware-vmx.exe 22116 [ws@4413 threadName="vmx"] SVGAFeature renderer (before clamping) svga.maxTextureSize num 16384
2025-12-14T09:04:59.025Z -INFO vmware-vmx.exe 22116 [ws@4413 threadName="vmx"] SVGAFeature renderer (before clamping) svga.maxVolumeExtent num 2048
2025-12-14T09:04:59.025Z -INFO vmware-vmx.exe 22116 [ws@4413 threadName="vmx"] SVGAFeature renderer (before clamping) svga.maxTextureAnisotropy num 16
2025-12-14T09:04:59.025Z -INFO vmware-vmx.exe 22116 [ws@4413 threadName="vmx"] SVGAFeature renderer (before clamping) svga.lineStipple bool 0
2025-12-14T09:04:59.025Z -INFO vmware-vmx.exe 22116 [ws@4413 threadName="vmx"] SVGAFeature renderer (before clamping) svga.dxMaxConstantBuffers num 15
2025-12-14T09:04:59.025Z -INFO vmware-vmx.exe 22116 [ws@4413 threadName="vmx"] SVGAFeature renderer (before clamping) svga.dxProvokingVertex bool 0
2025-12-14T09:04:59.025Z -INFO vmware-vmx.exe 22116 [ws@4413 threadName="vmx"] SVGAFeature renderer (before clamping) svga.sm41 bool 1
2025-12-14T09:04:59.025Z -INFO vmware-vmx.exe 22116 [ws@4413 threadName="vmx"] SVGAFeature renderer (before clamping) svga.multisample2x bool 1
2025-12-14T09:04:59.025Z -INFO vmware-vmx.exe 22116 [ws@4413 threadName="vmx"] SVGAFeature renderer (before clamping) svga.multisample4x bool 1
2025-12-14T09:04:59.025Z -INFO vmware-vmx.exe 22116 [ws@4413 threadName="vmx"] SVGAFeature renderer (before clamping) svga.msFullQuality bool 1
2025-12-14T09:04:59.025Z -INFO vmware-vmx.exe 22116 [ws@4413 threadName="vmx"] SVGAFeature renderer (before clamping) svga.logicOps bool 1
2025-12-14T09:04:59.025Z -INFO vmware-vmx.exe 22116 [ws@4413 threadName="vmx"] SVGAFeature renderer (before clamping) svga.bc67 num 9
2025-12-14T09:04:59.025Z -INFO vmware-vmx.exe 22116 [ws@4413 threadName="vmx"] SVGAFeature renderer (before clamping) svga.sm5 bool 1
2025-12-14T09:04:59.025Z -INFO vmware-vmx.exe 22116 [ws@4413 threadName="vmx"] SVGAFeature renderer (before clamping) svga.multisample8x bool 1
2025-12-14T09:04:59.025Z -INFO vmware-vmx.exe 22116 [ws@4413 threadName="vmx"] SVGAFeature renderer (before clamping) svga.logicBlendOps bool 0
2025-12-14T09:04:59.025Z -INFO vmware-vmx.exe 22116 [ws@4413 threadName="vmx"] SVGAFeature renderer (before clamping) svga.maxForcedSampleCount num 16
2025-12-14T09:04:59.025Z -INFO vmware-vmx.exe 22116 [ws@4413 threadName="vmx"] SVGAFeature renderer (before clamping) svga.gl43 bool 1
2025-12-14T09:04:59.025Z -INFO vmware-vmx.exe 22116 [ws@4413 threadName="vmx"] SVGAFeature renderer (after clamping) svga.supports3D bool 1
2025-12-14T09:04:59.025Z -INFO vmware-vmx.exe 22116 [ws@4413 threadName="vmx"] SVGAFeature renderer (after clamping) svga.baseCapsLevel num 9
2025-12-14T09:04:59.025Z -INFO vmware-vmx.exe 22116 [ws@4413 threadName="vmx"] SVGAFeature renderer (after clamping) svga.maxPointSize num 1
2025-12-14T09:04:59.025Z -INFO vmware-vmx.exe 22116 [ws@4413 threadName="vmx"] SVGAFeature renderer (after clamping) svga.maxTextureSize num 16384
2025-12-14T09:04:59.025Z -INFO vmware-vmx.exe 22116 [ws@4413 threadName="vmx"] SVGAFeature renderer (after clamping) svga.maxVolumeExtent num 2048
2025-12-14T09:04:59.025Z -INFO vmware-vmx.exe 22116 [ws@4413 threadName="vmx"] SVGAFeature renderer (after clamping) svga.maxTextureAnisotropy num 16
2025-12-14T09:04:59.025Z -INFO vmware-vmx.exe 22116 [ws@4413 threadName="vmx"] SVGAFeature renderer (after clamping) svga.lineStipple bool 0
2025-12-14T09:04:59.025Z -INFO vmware-vmx.exe 22116 [ws@4413 threadName="vmx"] SVGAFeature renderer (after clamping) svga.dxMaxConstantBuffers num 15
2025-12-14T09:04:59.025Z -INFO vmware-vmx.exe 22116 [ws@4413 threadName="vmx"] SVGAFeature renderer (after clamping) svga.dxProvokingVertex bool 0
2025-12-14T09:04:59.025Z -INFO vmware-vmx.exe 22116 [ws@4413 threadName="vmx"] SVGAFeature renderer (after clamping) svga.sm41 bool 1
2025-12-14T09:04:59.025Z -INFO vmware-vmx.exe 22116 [ws@4413 threadName="vmx"] SVGAFeature renderer (after clamping) svga.multisample2x bool 1
2025-12-14T09:04:59.025Z -INFO vmware-vmx.exe 22116 [ws@4413 threadName="vmx"] SVGAFeature renderer (after clamping) svga.multisample4x bool 1
2025-12-14T09:04:59.025Z -INFO vmware-vmx.exe 22116 [ws@4413 threadName="vmx"] SVGAFeature renderer (after clamping) svga.msFullQuality bool 1
2025-12-14T09:04:59.025Z -INFO vmware-vmx.exe 22116 [ws@4413 threadName="vmx"] SVGAFeature renderer (after clamping) svga.logicOps bool 1
2025-12-14T09:04:59.025Z -INFO vmware-vmx.exe 22116 [ws@4413 threadName="vmx"] SVGAFeature renderer (after clamping) svga.bc67 num 9
2025-12-14T09:04:59.025Z -INFO vmware-vmx.exe 22116 [ws@4413 threadName="vmx"] SVGAFeature renderer (after clamping) svga.sm5 bool 1
2025-12-14T09:04:59.025Z -INFO vmware-vmx.exe 22116 [ws@4413 threadName="vmx"] SVGAFeature renderer (after clamping) svga.multisample8x bool 1
2025-12-14T09:04:59.025Z -INFO vmware-vmx.exe 22116 [ws@4413 threadName="vmx"] SVGAFeature renderer (after clamping) svga.logicBlendOps bool 0
2025-12-14T09:04:59.025Z -INFO vmware-vmx.exe 22116 [ws@4413 threadName="vmx"] SVGAFeature renderer (after clamping) svga.maxForcedSampleCount num 16
2025-12-14T09:04:59.025Z -INFO vmware-vmx.exe 22116 [ws@4413 threadName="vmx"] SVGAFeature renderer (after clamping) svga.gl43 bool 1
2025-12-14T09:04:59.025Z -INFO vmware-vmx.exe 22116 [ws@4413 threadName="vmx"] SVGA3dClamp: Renderer Provides BC67Level: 9 ( 9, 9)
2025-12-14T09:04:59.025Z -INFO vmware-vmx.exe 22116 [ws@4413 threadName="vmx"] SVGA3dClamp: Renderer Provides BaseCapsLevel: 9 ( 9, 9)
2025-12-14T09:04:59.025Z -INFO vmware-vmx.exe 22116 [ws@4413 threadName="vmx"] SVGA3dClamp: Renderer Provides ClampLevel: 0 ( 0, 10)
2025-12-14T09:04:59.025Z -INFO vmware-vmx.exe 22116 [ws@4413 threadName="vmx"] SVGA3dCaps: host, at power on (3d enabled)
2025-12-14T09:04:59.025Z -INFO vmware-vmx.exe 22116 [ws@4413 threadName="vmx"] cap[ 0]: 0x00000001 (3D)
2025-12-14T09:04:59.025Z -INFO vmware-vmx.exe 22116 [ws@4413 threadName="vmx"] cap[ 1]: 0x00000008 (MAX_LIGHTS)
2025-12-14T09:04:59.025Z -INFO vmware-vmx.exe 22116 [ws@4413 threadName="vmx"] cap[ 2]: 0x00000008 (MAX_TEXTURES)
2025-12-14T09:04:59.025Z -INFO vmware-vmx.exe 22116 [ws@4413 threadName="vmx"] cap[ 3]: 0x00000008 (MAX_CLIP_PLANES)
2025-12-14T09:04:59.025Z -INFO vmware-vmx.exe 22116 [ws@4413 threadName="vmx"] cap[ 4]: 0x00000007 (VERTEX_SHADER_VERSION)
2025-12-14T09:04:59.025Z -INFO vmware-vmx.exe 22116 [ws@4413 threadName="vmx"] cap[ 5]: 0x00000001 (VERTEX_SHADER)
2025-12-14T09:04:59.025Z -INFO vmware-vmx.exe 22116 [ws@4413 threadName="vmx"] cap[ 6]: 0x0000000d (FRAGMENT_SHADER_VERSION)
2025-12-14T09:04:59.025Z -INFO vmware-vmx.exe 22116 [ws@4413 threadName="vmx"] cap[ 7]: 0x00000001 (FRAGMENT_SHADER)
2025-12-14T09:04:59.025Z -INFO vmware-vmx.exe 22116 [ws@4413 threadName="vmx"] cap[ 8]: 0x00000008 (MAX_RENDER_TARGETS)
2025-12-14T09:04:59.026Z -INFO vmware-vmx.exe 22116 [ws@4413 threadName="vmx"] cap[ 9]: 0x00000001 (S23E8_TEXTURES)
2025-12-14T09:04:59.026Z -INFO vmware-vmx.exe 22116 [ws@4413 threadName="vmx"] cap[ 10]: 0x00000001 (S10E5_TEXTURES)
2025-12-14T09:04:59.026Z -INFO vmware-vmx.exe 22116 [ws@4413 threadName="vmx"] cap[ 11]: 0x00000004 (MAX_FIXED_VERTEXBLEND)
2025-12-14T09:04:59.026Z -INFO vmware-vmx.exe 22116 [ws@4413 threadName="vmx"] cap[ 12]: 0x00000001 (D16_BUFFER_FORMAT)
2025-12-14T09:04:59.026Z -INFO vmware-vmx.exe 22116 [ws@4413 threadName="vmx"] cap[ 13]: 0x00000001 (D24S8_BUFFER_FORMAT)
2025-12-14T09:04:59.026Z -INFO vmware-vmx.exe 22116 [ws@4413 threadName="vmx"] cap[ 14]: 0x00000001 (D24X8_BUFFER_FORMAT)
2025-12-14T09:04:59.026Z -INFO vmware-vmx.exe 22116 [ws@4413 threadName="vmx"] cap[ 15]: 0x00000001 (QUERY_TYPES)
2025-12-14T09:04:59.026Z -INFO vmware-vmx.exe 22116 [ws@4413 threadName="vmx"] cap[ 16]: 0x00000001 (TEXTURE_GRADIENT_SAMPLING)
2025-12-14T09:04:59.026Z -INFO vmware-vmx.exe 22116 [ws@4413 threadName="vmx"] cap[ 17]: 1.000000 (MAX_POINT_SIZE)
2025-12-14T09:04:59.026Z -INFO vmware-vmx.exe 22116 [ws@4413 threadName="vmx"] cap[ 18]: 0x00000014 (MAX_SHADER_TEXTURES)
2025-12-14T09:04:59.026Z -INFO vmware-vmx.exe 22116 [ws@4413 threadName="vmx"] cap[ 19]: 0x00004000 (MAX_TEXTURE_WIDTH)
2025-12-14T09:04:59.026Z -INFO vmware-vmx.exe 22116 [ws@4413 threadName="vmx"] cap[ 20]: 0x00004000 (MAX_TEXTURE_HEIGHT)
2025-12-14T09:04:59.026Z -INFO vmware-vmx.exe 22116 [ws@4413 threadName="vmx"] cap[ 21]: 0x00000800 (MAX_VOLUME_EXTENT)
2025-12-14T09:04:59.026Z -INFO vmware-vmx.exe 22116 [ws@4413 threadName="vmx"] cap[ 22]: 0x00004000 (MAX_TEXTURE_REPEAT)
2025-12-14T09:04:59.026Z -INFO vmware-vmx.exe 22116 [ws@4413 threadName="vmx"] cap[ 23]: 0x00004000 (MAX_TEXTURE_ASPECT_RATIO)
2025-12-14T09:04:59.026Z -INFO vmware-vmx.exe 22116 [ws@4413 threadName="vmx"] cap[ 24]: 0x00000010 (MAX_TEXTURE_ANISOTROPY)
2025-12-14T09:04:59.026Z -INFO vmware-vmx.exe 22116 [ws@4413 threadName="vmx"] cap[ 25]: 0x001fffff (MAX_PRIMITIVE_COUNT)
2025-12-14T09:04:59.026Z -INFO vmware-vmx.exe 22116 [ws@4413 threadName="vmx"] cap[ 26]: 0x000fffff (MAX_VERTEX_INDEX)
2025-12-14T09:04:59.026Z -INFO vmware-vmx.exe 22116 [ws@4413 threadName="vmx"] cap[ 27]: 0x0000ffff (MAX_VERTEX_SHADER_INSTRUCTIONS)
2025-12-14T09:04:59.026Z -INFO vmware-vmx.exe 22116 [ws@4413 threadName="vmx"] cap[ 28]: 0x0000ffff (MAX_FRAGMENT_SHADER_INSTRUCTIONS)
2025-12-14T09:04:59.026Z -INFO vmware-vmx.exe 22116 [ws@4413 threadName="vmx"] cap[ 29]: 0x00000020 (MAX_VERTEX_SHADER_TEMPS)
2025-12-14T09:04:59.026Z -INFO vmware-vmx.exe 22116 [ws@4413 threadName="vmx"] cap[ 30]: 0x00000020 (MAX_FRAGMENT_SHADER_TEMPS)
2025-12-14T09:04:59.026Z -INFO vmware-vmx.exe 22116 [ws@4413 threadName="vmx"] cap[ 31]: 0x03ffffff (TEXTURE_OPS)
2025-12-14T09:04:59.026Z -INFO vmware-vmx.exe 22116 [ws@4413 threadName="vmx"] cap[ 32]: 0x0018ec1f (SURFACEFMT_X8R8G8B8)
2025-12-14T09:04:59.026Z -INFO vmware-vmx.exe 22116 [ws@4413 threadName="vmx"] cap[ 33]: 0x0018e11f (SURFACEFMT_A8R8G8B8)
2025-12-14T09:04:59.026Z -INFO vmware-vmx.exe 22116 [ws@4413 threadName="vmx"] cap[ 34]: 0x0008601f (SURFACEFMT_A2R10G10B10)
2025-12-14T09:04:59.026Z -INFO vmware-vmx.exe 22116 [ws@4413 threadName="vmx"] cap[ 35]: 0x0008601f (SURFACEFMT_X1R5G5B5)
2025-12-14T09:04:59.026Z -INFO vmware-vmx.exe 22116 [ws@4413 threadName="vmx"] cap[ 36]: 0x0008611f (SURFACEFMT_A1R5G5B5)
2025-12-14T09:04:59.026Z -INFO vmware-vmx.exe 22116 [ws@4413 threadName="vmx"] cap[ 37]: 0x0000611f (SURFACEFMT_A4R4G4B4)
2025-12-14T09:04:59.026Z -INFO vmware-vmx.exe 22116 [ws@4413 threadName="vmx"] cap[ 38]: 0x0018ec1f (SURFACEFMT_R5G6B5)
2025-12-14T09:04:59.026Z -INFO vmware-vmx.exe 22116 [ws@4413 threadName="vmx"] cap[ 39]: 0x0000601f (SURFACEFMT_LUMINANCE16)
2025-12-14T09:04:59.026Z -INFO vmware-vmx.exe 22116 [ws@4413 threadName="vmx"] cap[ 40]: 0x00006007 (SURFACEFMT_LUMINANCE8_ALPHA8)
2025-12-14T09:04:59.026Z -INFO vmware-vmx.exe 22116 [ws@4413 threadName="vmx"] cap[ 41]: 0x0000601f (SURFACEFMT_ALPHA8)
2025-12-14T09:04:59.026Z -INFO vmware-vmx.exe 22116 [ws@4413 threadName="vmx"] cap[ 42]: 0x0000601f (SURFACEFMT_LUMINANCE8)
2025-12-14T09:04:59.026Z -INFO vmware-vmx.exe 22116 [ws@4413 threadName="vmx"] cap[ 43]: 0x000040c5 (SURFACEFMT_Z_D16)
2025-12-14T09:04:59.026Z -INFO vmware-vmx.exe 22116 [ws@4413 threadName="vmx"] cap[ 44]: 0x000040c5 (SURFACEFMT_Z_D24S8)
2025-12-14T09:04:59.026Z -INFO vmware-vmx.exe 22116 [ws@4413 threadName="vmx"] cap[ 45]: 0x000040c5 (SURFACEFMT_Z_D24X8)
2025-12-14T09:04:59.026Z -INFO vmware-vmx.exe 22116 [ws@4413 threadName="vmx"] cap[ 46]: 0x0000e005 (SURFACEFMT_DXT1)
2025-12-14T09:04:59.026Z -INFO vmware-vmx.exe 22116 [ws@4413 threadName="vmx"] cap[ 47]: 0x0000e005 (SURFACEFMT_DXT2)
2025-12-14T09:04:59.026Z -INFO vmware-vmx.exe 22116 [ws@4413 threadName="vmx"] cap[ 48]: 0x0000e005 (SURFACEFMT_DXT3)
2025-12-14T09:04:59.026Z -INFO vmware-vmx.exe 22116 [ws@4413 threadName="vmx"] cap[ 49]: 0x0000e005 (SURFACEFMT_DXT4)
2025-12-14T09:04:59.026Z -INFO vmware-vmx.exe 22116 [ws@4413 threadName="vmx"] cap[ 50]: 0x0000e005 (SURFACEFMT_DXT5)
2025-12-14T09:04:59.026Z -INFO vmware-vmx.exe 22116 [ws@4413 threadName="vmx"] cap[ 51]: 0x00014005 (SURFACEFMT_BUMPX8L8V8U8)
2025-12-14T09:04:59.026Z -INFO vmware-vmx.exe 22116 [ws@4413 threadName="vmx"] cap[ 52]: 0x00014007 (SURFACEFMT_A2W10V10U10)
2025-12-14T09:04:59.026Z -INFO vmware-vmx.exe 22116 [ws@4413 threadName="vmx"] cap[ 53]: 0x00014007 (SURFACEFMT_BUMPU8V8)
2025-12-14T09:04:59.026Z -INFO vmware-vmx.exe 22116 [ws@4413 threadName="vmx"] cap[ 54]: 0x00014005 (SURFACEFMT_Q8W8V8U8)
2025-12-14T09:04:59.026Z -INFO vmware-vmx.exe 22116 [ws@4413 threadName="vmx"] cap[ 55]: 0x00014001 (SURFACEFMT_CxV8U8)
2025-12-14T09:04:59.026Z -INFO vmware-vmx.exe 22116 [ws@4413 threadName="vmx"] cap[ 56]: 0x0080601f (SURFACEFMT_R_S10E5)
2025-12-14T09:04:59.026Z -INFO vmware-vmx.exe 22116 [ws@4413 threadName="vmx"] cap[ 57]: 0x0080601f (SURFACEFMT_R_S23E8)
2025-12-14T09:04:59.026Z -INFO vmware-vmx.exe 22116 [ws@4413 threadName="vmx"] cap[ 58]: 0x0080601f (SURFACEFMT_RG_S10E5)
2025-12-14T09:04:59.026Z -INFO vmware-vmx.exe 22116 [ws@4413 threadName="vmx"] cap[ 59]: 0x0080601f (SURFACEFMT_RG_S23E8)
2025-12-14T09:04:59.026Z -INFO vmware-vmx.exe 22116 [ws@4413 threadName="vmx"] cap[ 60]: 0x0080601f (SURFACEFMT_ARGB_S10E5)
2025-12-14T09:04:59.026Z -INFO vmware-vmx.exe 22116 [ws@4413 threadName="vmx"] cap[ 61]: 0x0080601f (SURFACEFMT_ARGB_S23E8)
2025-12-14T09:04:59.026Z -INFO vmware-vmx.exe 22116 [ws@4413 threadName="vmx"] cap[ 62]: 0x00000000 (MISSING62)
2025-12-14T09:04:59.026Z -INFO vmware-vmx.exe 22116 [ws@4413 threadName="vmx"] cap[ 63]: 0x00000004 (MAX_VERTEX_SHADER_TEXTURES)
2025-12-14T09:04:59.026Z -INFO vmware-vmx.exe 22116 [ws@4413 threadName="vmx"] cap[ 64]: 0x00000008 (MAX_SIMULTANEOUS_RENDER_TARGETS)
2025-12-14T09:04:59.026Z -INFO vmware-vmx.exe 22116 [ws@4413 threadName="vmx"] cap[ 65]: 0x00014007 (SURFACEFMT_V16U16)
2025-12-14T09:04:59.026Z -INFO vmware-vmx.exe 22116 [ws@4413 threadName="vmx"] cap[ 66]: 0x0000601f (SURFACEFMT_G16R16)
2025-12-14T09:04:59.026Z -INFO vmware-vmx.exe 22116 [ws@4413 threadName="vmx"] cap[ 67]: 0x0000601f (SURFACEFMT_A16B16G16R16)
2025-12-14T09:04:59.026Z -INFO vmware-vmx.exe 22116 [ws@4413 threadName="vmx"] cap[ 68]: 0x01246000 (SURFACEFMT_UYVY)
2025-12-14T09:04:59.026Z -INFO vmware-vmx.exe 22116 [ws@4413 threadName="vmx"] cap[ 69]: 0x01246000 (SURFACEFMT_YUY2)
2025-12-14T09:04:59.026Z -INFO vmware-vmx.exe 22116 [ws@4413 threadName="vmx"] cap[ 70]: 0x00000000 (DEAD4)
2025-12-14T09:04:59.026Z -INFO vmware-vmx.exe 22116 [ws@4413 threadName="vmx"] cap[ 71]: 0x00000000 (DEAD5)
2025-12-14T09:04:59.026Z -INFO vmware-vmx.exe 22116 [ws@4413 threadName="vmx"] cap[ 72]: 0x00000000 (DEAD7)
2025-12-14T09:04:59.026Z -INFO vmware-vmx.exe 22116 [ws@4413 threadName="vmx"] cap[ 73]: 0x00000000 (DEAD6)
2025-12-14T09:04:59.026Z -INFO vmware-vmx.exe 22116 [ws@4413 threadName="vmx"] cap[ 74]: 0x00000001 (AUTOGENMIPMAPS)
2025-12-14T09:04:59.026Z -INFO vmware-vmx.exe 22116 [ws@4413 threadName="vmx"] cap[ 75]: 0x01246000 (SURFACEFMT_NV12)
2025-12-14T09:04:59.026Z -INFO vmware-vmx.exe 22116 [ws@4413 threadName="vmx"] cap[ 76]: 0x00000000 (DEAD10)
2025-12-14T09:04:59.026Z -INFO vmware-vmx.exe 22116 [ws@4413 threadName="vmx"] cap[ 77]: 0x00000100 (MAX_CONTEXT_IDS)
2025-12-14T09:04:59.026Z -INFO vmware-vmx.exe 22116 [ws@4413 threadName="vmx"] cap[ 78]: 0x00008000 (MAX_SURFACE_IDS)
2025-12-14T09:04:59.026Z -INFO vmware-vmx.exe 22116 [ws@4413 threadName="vmx"] cap[ 79]: 0x000040c5 (SURFACEFMT_Z_DF16)
2025-12-14T09:04:59.026Z -INFO vmware-vmx.exe 22116 [ws@4413 threadName="vmx"] cap[ 80]: 0x000040c5 (SURFACEFMT_Z_DF24)
2025-12-14T09:04:59.026Z -INFO vmware-vmx.exe 22116 [ws@4413 threadName="vmx"] cap[ 81]: 0x000040c5 (SURFACEFMT_Z_D24S8_INT)
2025-12-14T09:04:59.026Z -INFO vmware-vmx.exe 22116 [ws@4413 threadName="vmx"] cap[ 82]: 0x00006005 (SURFACEFMT_ATI1)
2025-12-14T09:04:59.026Z -INFO vmware-vmx.exe 22116 [ws@4413 threadName="vmx"] cap[ 83]: 0x00006005 (SURFACEFMT_ATI2)
2025-12-14T09:04:59.026Z -INFO vmware-vmx.exe 22116 [ws@4413 threadName="vmx"] cap[ 84]: 0x00000000 (DEAD1)
2025-12-14T09:04:59.026Z -INFO vmware-vmx.exe 22116 [ws@4413 threadName="vmx"] cap[ 85]: 0x00000000 (DEAD8)
2025-12-14T09:04:59.026Z -INFO vmware-vmx.exe 22116 [ws@4413 threadName="vmx"] cap[ 86]: 0x00000000 (DEAD9)
2025-12-14T09:04:59.026Z -INFO vmware-vmx.exe 22116 [ws@4413 threadName="vmx"] cap[ 87]: 0x00000001 (LINE_AA)
2025-12-14T09:04:59.026Z -INFO vmware-vmx.exe 22116 [ws@4413 threadName="vmx"] cap[ 88]: 0x00000000 (LINE_STIPPLE)
2025-12-14T09:04:59.026Z -INFO vmware-vmx.exe 22116 [ws@4413 threadName="vmx"] cap[ 89]: 10.000000 (MAX_LINE_WIDTH)
2025-12-14T09:04:59.026Z -INFO vmware-vmx.exe 22116 [ws@4413 threadName="vmx"] cap[ 90]: 10.000000 (MAX_AA_LINE_WIDTH)
2025-12-14T09:04:59.026Z -INFO vmware-vmx.exe 22116 [ws@4413 threadName="vmx"] cap[ 91]: 0x01246000 (SURFACEFMT_YV12)
2025-12-14T09:04:59.026Z -INFO vmware-vmx.exe 22116 [ws@4413 threadName="vmx"] cap[ 92]: 0x00000000 (DEAD3)
2025-12-14T09:04:59.026Z -INFO vmware-vmx.exe 22116 [ws@4413 threadName="vmx"] cap[ 93]: 0x00000001 (TS_COLOR_KEY)
2025-12-14T09:04:59.026Z -INFO vmware-vmx.exe 22116 [ws@4413 threadName="vmx"] cap[ 94]: 0x00000000 (DEAD2)
2025-12-14T09:04:59.026Z -INFO vmware-vmx.exe 22116 [ws@4413 threadName="vmx"] cap[ 95]: 0x00000001 (DXCONTEXT)
2025-12-14T09:04:59.026Z -INFO vmware-vmx.exe 22116 [ws@4413 threadName="vmx"] cap[ 96]: 0x00000000 (DEAD11)
2025-12-14T09:04:59.026Z -INFO vmware-vmx.exe 22116 [ws@4413 threadName="vmx"] cap[ 97]: 0x00000010 (DX_MAX_VERTEXBUFFERS)
2025-12-14T09:04:59.026Z -INFO vmware-vmx.exe 22116 [ws@4413 threadName="vmx"] cap[ 98]: 0x0000000f (DX_MAX_CONSTANT_BUFFERS)
2025-12-14T09:04:59.026Z -INFO vmware-vmx.exe 22116 [ws@4413 threadName="vmx"] cap[ 99]: 0x00000000 (DX_PROVOKING_VERTEX)
2025-12-14T09:04:59.026Z -INFO vmware-vmx.exe 22116 [ws@4413 threadName="vmx"] cap[100]: 0x000002f7 (DXFMT_X8R8G8B8)
2025-12-14T09:04:59.026Z -INFO vmware-vmx.exe 22116 [ws@4413 threadName="vmx"] cap[101]: 0x000003f7 (DXFMT_A8R8G8B8)
2025-12-14T09:04:59.026Z -INFO vmware-vmx.exe 22116 [ws@4413 threadName="vmx"] cap[102]: 0x000002f7 (DXFMT_R5G6B5)
2025-12-14T09:04:59.026Z -INFO vmware-vmx.exe 22116 [ws@4413 threadName="vmx"] cap[103]: 0x000000f7 (DXFMT_X1R5G5B5)
2025-12-14T09:04:59.026Z -INFO vmware-vmx.exe 22116 [ws@4413 threadName="vmx"] cap[104]: 0x000000f7 (DXFMT_A1R5G5B5)
2025-12-14T09:04:59.026Z -INFO vmware-vmx.exe 22116 [ws@4413 threadName="vmx"] cap[105]: 0x000000f7 (DXFMT_A4R4G4B4)
2025-12-14T09:04:59.026Z -INFO vmware-vmx.exe 22116 [ws@4413 threadName="vmx"] cap[106]: 0x00000009 (DXFMT_Z_D32)
2025-12-14T09:04:59.026Z -INFO vmware-vmx.exe 22116 [ws@4413 threadName="vmx"] cap[107]: 0x0000026b (DXFMT_Z_D16)
2025-12-14T09:04:59.026Z -INFO vmware-vmx.exe 22116 [ws@4413 threadName="vmx"] cap[108]: 0x0000026b (DXFMT_Z_D24S8)
2025-12-14T09:04:59.026Z -INFO vmware-vmx.exe 22116 [ws@4413 threadName="vmx"] cap[109]: 0x0000000b (DXFMT_Z_D15S1)
2025-12-14T09:04:59.026Z -INFO vmware-vmx.exe 22116 [ws@4413 threadName="vmx"] cap[110]: 0x000000f7 (DXFMT_LUMINANCE8)
2025-12-14T09:04:59.026Z -INFO vmware-vmx.exe 22116 [ws@4413 threadName="vmx"] cap[111]: 0x000000e3 (DXFMT_LUMINANCE4_ALPHA4)
2025-12-14T09:04:59.026Z -INFO vmware-vmx.exe 22116 [ws@4413 threadName="vmx"] cap[112]: 0x000000f7 (DXFMT_LUMINANCE16)
2025-12-14T09:04:59.026Z -INFO vmware-vmx.exe 22116 [ws@4413 threadName="vmx"] cap[113]: 0x000000e3 (DXFMT_LUMINANCE8_ALPHA8)
2025-12-14T09:04:59.026Z -INFO vmware-vmx.exe 22116 [ws@4413 threadName="vmx"] cap[114]: 0x00000063 (DXFMT_DXT1)
2025-12-14T09:04:59.026Z -INFO vmware-vmx.exe 22116 [ws@4413 threadName="vmx"] cap[115]: 0x00000063 (DXFMT_DXT2)
2025-12-14T09:04:59.026Z -INFO vmware-vmx.exe 22116 [ws@4413 threadName="vmx"] cap[116]: 0x00000063 (DXFMT_DXT3)
2025-12-14T09:04:59.026Z -INFO vmware-vmx.exe 22116 [ws@4413 threadName="vmx"] cap[117]: 0x00000063 (DXFMT_DXT4)
2025-12-14T09:04:59.027Z -INFO vmware-vmx.exe 22116 [ws@4413 threadName="vmx"] cap[118]: 0x00000063 (DXFMT_DXT5)
2025-12-14T09:04:59.027Z -INFO vmware-vmx.exe 22116 [ws@4413 threadName="vmx"] cap[119]: 0x000000e3 (DXFMT_BUMPU8V8)
2025-12-14T09:04:59.027Z -INFO vmware-vmx.exe 22116 [ws@4413 threadName="vmx"] cap[120]: 0x00000000 (DXFMT_BUMPL6V5U5)
2025-12-14T09:04:59.027Z -INFO vmware-vmx.exe 22116 [ws@4413 threadName="vmx"] cap[121]: 0x00000063 (DXFMT_BUMPX8L8V8U8)
2025-12-14T09:04:59.027Z -INFO vmware-vmx.exe 22116 [ws@4413 threadName="vmx"] cap[122]: 0x00000000 (DXFMT_FORMAT_DEAD1)
2025-12-14T09:04:59.027Z -INFO vmware-vmx.exe 22116 [ws@4413 threadName="vmx"] cap[123]: 0x000003f7 (DXFMT_ARGB_S10E5)
2025-12-14T09:04:59.027Z -INFO vmware-vmx.exe 22116 [ws@4413 threadName="vmx"] cap[124]: 0x000003f7 (DXFMT_ARGB_S23E8)
2025-12-14T09:04:59.027Z -INFO vmware-vmx.exe 22116 [ws@4413 threadName="vmx"] cap[125]: 0x000003f7 (DXFMT_A2R10G10B10)
2025-12-14T09:04:59.027Z -INFO vmware-vmx.exe 22116 [ws@4413 threadName="vmx"] cap[126]: 0x000000e3 (DXFMT_V8U8)
2025-12-14T09:04:59.027Z -INFO vmware-vmx.exe 22116 [ws@4413 threadName="vmx"] cap[127]: 0x00000063 (DXFMT_Q8W8V8U8)
2025-12-14T09:04:59.027Z -INFO vmware-vmx.exe 22116 [ws@4413 threadName="vmx"] cap[128]: 0x00000063 (DXFMT_CxV8U8)
2025-12-14T09:04:59.027Z -INFO vmware-vmx.exe 22116 [ws@4413 threadName="vmx"] cap[129]: 0x000000e3 (DXFMT_X8L8V8U8)
2025-12-14T09:04:59.027Z -INFO vmware-vmx.exe 22116 [ws@4413 threadName="vmx"] cap[130]: 0x000000e3 (DXFMT_A2W10V10U10)
2025-12-14T09:04:59.027Z -INFO vmware-vmx.exe 22116 [ws@4413 threadName="vmx"] cap[131]: 0x000000f7 (DXFMT_ALPHA8)
2025-12-14T09:04:59.027Z -INFO vmware-vmx.exe 22116 [ws@4413 threadName="vmx"] cap[132]: 0x000003f7 (DXFMT_R_S10E5)
2025-12-14T09:04:59.027Z -INFO vmware-vmx.exe 22116 [ws@4413 threadName="vmx"] cap[133]: 0x000003f7 (DXFMT_R_S23E8)
2025-12-14T09:04:59.027Z -INFO vmware-vmx.exe 22116 [ws@4413 threadName="vmx"] cap[134]: 0x000003f7 (DXFMT_RG_S10E5)
2025-12-14T09:04:59.027Z -INFO vmware-vmx.exe 22116 [ws@4413 threadName="vmx"] cap[135]: 0x000003f7 (DXFMT_RG_S23E8)
2025-12-14T09:04:59.027Z -INFO vmware-vmx.exe 22116 [ws@4413 threadName="vmx"] cap[136]: 0x00000001 (DXFMT_BUFFER)
2025-12-14T09:04:59.027Z -INFO vmware-vmx.exe 22116 [ws@4413 threadName="vmx"] cap[137]: 0x0000026b (DXFMT_Z_D24X8)
2025-12-14T09:04:59.027Z -INFO vmware-vmx.exe 22116 [ws@4413 threadName="vmx"] cap[138]: 0x000001e3 (DXFMT_V16U16)
2025-12-14T09:04:59.027Z -INFO vmware-vmx.exe 22116 [ws@4413 threadName="vmx"] cap[139]: 0x000003f7 (DXFMT_G16R16)
2025-12-14T09:04:59.027Z -INFO vmware-vmx.exe 22116 [ws@4413 threadName="vmx"] cap[140]: 0x000001f7 (DXFMT_A16B16G16R16)
2025-12-14T09:04:59.027Z -INFO vmware-vmx.exe 22116 [ws@4413 threadName="vmx"] cap[141]: 0x00000001 (DXFMT_UYVY)
2025-12-14T09:04:59.027Z -INFO vmware-vmx.exe 22116 [ws@4413 threadName="vmx"] cap[142]: 0x00000041 (DXFMT_YUY2)
2025-12-14T09:04:59.027Z -INFO vmware-vmx.exe 22116 [ws@4413 threadName="vmx"] cap[143]: 0x00000041 (DXFMT_NV12)
2025-12-14T09:04:59.027Z -INFO vmware-vmx.exe 22116 [ws@4413 threadName="vmx"] cap[144]: 0x00000000 (DXFMT_FORMAT_DEAD2)
2025-12-14T09:04:59.027Z -INFO vmware-vmx.exe 22116 [ws@4413 threadName="vmx"] cap[145]: 0x000002e1 (DXFMT_R32G32B32A32_TYPELESS)
2025-12-14T09:04:59.027Z -INFO vmware-vmx.exe 22116 [ws@4413 threadName="vmx"] cap[146]: 0x000003e7 (DXFMT_R32G32B32A32_UINT)
2025-12-14T09:04:59.027Z -INFO vmware-vmx.exe 22116 [ws@4413 threadName="vmx"] cap[147]: 0x000003e7 (DXFMT_R32G32B32A32_SINT)
2025-12-14T09:04:59.027Z -INFO vmware-vmx.exe 22116 [ws@4413 threadName="vmx"] cap[148]: 0x000000e1 (DXFMT_R32G32B32_TYPELESS)
2025-12-14T09:04:59.027Z -INFO vmware-vmx.exe 22116 [ws@4413 threadName="vmx"] cap[149]: 0x000001e3 (DXFMT_R32G32B32_FLOAT)
2025-12-14T09:04:59.027Z -INFO vmware-vmx.exe 22116 [ws@4413 threadName="vmx"] cap[150]: 0x000001e3 (DXFMT_R32G32B32_UINT)
2025-12-14T09:04:59.027Z -INFO vmware-vmx.exe 22116 [ws@4413 threadName="vmx"] cap[151]: 0x000001e3 (DXFMT_R32G32B32_SINT)
2025-12-14T09:04:59.027Z -INFO vmware-vmx.exe 22116 [ws@4413 threadName="vmx"] cap[152]: 0x000002e1 (DXFMT_R16G16B16A16_TYPELESS)
2025-12-14T09:04:59.027Z -INFO vmware-vmx.exe 22116 [ws@4413 threadName="vmx"] cap[153]: 0x000003e7 (DXFMT_R16G16B16A16_UINT)
2025-12-14T09:04:59.027Z -INFO vmware-vmx.exe 22116 [ws@4413 threadName="vmx"] cap[154]: 0x000003f7 (DXFMT_R16G16B16A16_SNORM)
2025-12-14T09:04:59.027Z -INFO vmware-vmx.exe 22116 [ws@4413 threadName="vmx"] cap[155]: 0x000003e7 (DXFMT_R16G16B16A16_SINT)
2025-12-14T09:04:59.027Z -INFO vmware-vmx.exe 22116 [ws@4413 threadName="vmx"] cap[156]: 0x000002e1 (DXFMT_R32G32_TYPELESS)
2025-12-14T09:04:59.027Z -INFO vmware-vmx.exe 22116 [ws@4413 threadName="vmx"] cap[157]: 0x000003e7 (DXFMT_R32G32_UINT)
2025-12-14T09:04:59.027Z -INFO vmware-vmx.exe 22116 [ws@4413 threadName="vmx"] cap[158]: 0x000003e7 (DXFMT_R32G32_SINT)
2025-12-14T09:04:59.027Z -INFO vmware-vmx.exe 22116 [ws@4413 threadName="vmx"] cap[159]: 0x00000261 (DXFMT_R32G8X24_TYPELESS)
2025-12-14T09:04:59.027Z -INFO vmware-vmx.exe 22116 [ws@4413 threadName="vmx"] cap[160]: 0x00000269 (DXFMT_D32_FLOAT_S8X24_UINT)
2025-12-14T09:04:59.027Z -INFO vmware-vmx.exe 22116 [ws@4413 threadName="vmx"] cap[161]: 0x00000063 (DXFMT_R32_FLOAT_X8X24)
2025-12-14T09:04:59.027Z -INFO vmware-vmx.exe 22116 [ws@4413 threadName="vmx"] cap[162]: 0x00000063 (DXFMT_X32_G8X24_UINT)
2025-12-14T09:04:59.027Z -INFO vmware-vmx.exe 22116 [ws@4413 threadName="vmx"] cap[163]: 0x000002e1 (DXFMT_R10G10B10A2_TYPELESS)
2025-12-14T09:04:59.027Z -INFO vmware-vmx.exe 22116 [ws@4413 threadName="vmx"] cap[164]: 0x000003e7 (DXFMT_R10G10B10A2_UINT)
2025-12-14T09:04:59.027Z -INFO vmware-vmx.exe 22116 [ws@4413 threadName="vmx"] cap[165]: 0x000003f7 (DXFMT_R11G11B10_FLOAT)
2025-12-14T09:04:59.027Z -INFO vmware-vmx.exe 22116 [ws@4413 threadName="vmx"] cap[166]: 0x000002e1 (DXFMT_R8G8B8A8_TYPELESS)
2025-12-14T09:04:59.027Z -INFO vmware-vmx.exe 22116 [ws@4413 threadName="vmx"] cap[167]: 0x000003f7 (DXFMT_R8G8B8A8_UNORM)
2025-12-14T09:04:59.027Z -INFO vmware-vmx.exe 22116 [ws@4413 threadName="vmx"] cap[168]: 0x000002f7 (DXFMT_R8G8B8A8_UNORM_SRGB)
2025-12-14T09:04:59.027Z -INFO vmware-vmx.exe 22116 [ws@4413 threadName="vmx"] cap[169]: 0x000003e7 (DXFMT_R8G8B8A8_UINT)
2025-12-14T09:04:59.027Z -INFO vmware-vmx.exe 22116 [ws@4413 threadName="vmx"] cap[170]: 0x000003e7 (DXFMT_R8G8B8A8_SINT)
2025-12-14T09:04:59.027Z -INFO vmware-vmx.exe 22116 [ws@4413 threadName="vmx"] cap[171]: 0x000002e1 (DXFMT_R16G16_TYPELESS)
2025-12-14T09:04:59.027Z -INFO vmware-vmx.exe 22116 [ws@4413 threadName="vmx"] cap[172]: 0x000003e7 (DXFMT_R16G16_UINT)
2025-12-14T09:04:59.027Z -INFO vmware-vmx.exe 22116 [ws@4413 threadName="vmx"] cap[173]: 0x000003e7 (DXFMT_R16G16_SINT)
2025-12-14T09:04:59.027Z -INFO vmware-vmx.exe 22116 [ws@4413 threadName="vmx"] cap[174]: 0x000002e1 (DXFMT_R32_TYPELESS)
2025-12-14T09:04:59.027Z -INFO vmware-vmx.exe 22116 [ws@4413 threadName="vmx"] cap[175]: 0x00000269 (DXFMT_D32_FLOAT)
2025-12-14T09:04:59.027Z -INFO vmware-vmx.exe 22116 [ws@4413 threadName="vmx"] cap[176]: 0x000003e7 (DXFMT_R32_UINT)
2025-12-14T09:04:59.027Z -INFO vmware-vmx.exe 22116 [ws@4413 threadName="vmx"] cap[177]: 0x000003e7 (DXFMT_R32_SINT)
2025-12-14T09:04:59.027Z -INFO vmware-vmx.exe 22116 [ws@4413 threadName="vmx"] cap[178]: 0x00000261 (DXFMT_R24G8_TYPELESS)
2025-12-14T09:04:59.027Z -INFO vmware-vmx.exe 22116 [ws@4413 threadName="vmx"] cap[179]: 0x00000269 (DXFMT_D24_UNORM_S8_UINT)
2025-12-14T09:04:59.027Z -INFO vmware-vmx.exe 22116 [ws@4413 threadName="vmx"] cap[180]: 0x00000063 (DXFMT_R24_UNORM_X8)
2025-12-14T09:04:59.027Z -INFO vmware-vmx.exe 22116 [ws@4413 threadName="vmx"] cap[181]: 0x00000063 (DXFMT_X24_G8_UINT)
2025-12-14T09:04:59.027Z -INFO vmware-vmx.exe 22116 [ws@4413 threadName="vmx"] cap[182]: 0x000002e1 (DXFMT_R8G8_TYPELESS)
2025-12-14T09:04:59.027Z -INFO vmware-vmx.exe 22116 [ws@4413 threadName="vmx"] cap[183]: 0x000003f7 (DXFMT_R8G8_UNORM)
2025-12-14T09:04:59.027Z -INFO vmware-vmx.exe 22116 [ws@4413 threadName="vmx"] cap[184]: 0x000003e7 (DXFMT_R8G8_UINT)
2025-12-14T09:04:59.027Z -INFO vmware-vmx.exe 22116 [ws@4413 threadName="vmx"] cap[185]: 0x000003e7 (DXFMT_R8G8_SINT)
2025-12-14T09:04:59.027Z -INFO vmware-vmx.exe 22116 [ws@4413 threadName="vmx"] cap[186]: 0x000002e1 (DXFMT_R16_TYPELESS)
2025-12-14T09:04:59.027Z -INFO vmware-vmx.exe 22116 [ws@4413 threadName="vmx"] cap[187]: 0x000003f7 (DXFMT_R16_UNORM)
2025-12-14T09:04:59.027Z -INFO vmware-vmx.exe 22116 [ws@4413 threadName="vmx"] cap[188]: 0x000003e7 (DXFMT_R16_UINT)
2025-12-14T09:04:59.027Z -INFO vmware-vmx.exe 22116 [ws@4413 threadName="vmx"] cap[189]: 0x000003f7 (DXFMT_R16_SNORM)
2025-12-14T09:04:59.027Z -INFO vmware-vmx.exe 22116 [ws@4413 threadName="vmx"] cap[190]: 0x000003e7 (DXFMT_R16_SINT)
2025-12-14T09:04:59.027Z -INFO vmware-vmx.exe 22116 [ws@4413 threadName="vmx"] cap[191]: 0x000002e1 (DXFMT_R8_TYPELESS)
2025-12-14T09:04:59.027Z -INFO vmware-vmx.exe 22116 [ws@4413 threadName="vmx"] cap[192]: 0x000003f7 (DXFMT_R8_UNORM)
2025-12-14T09:04:59.027Z -INFO vmware-vmx.exe 22116 [ws@4413 threadName="vmx"] cap[193]: 0x000003e7 (DXFMT_R8_UINT)
2025-12-14T09:04:59.027Z -INFO vmware-vmx.exe 22116 [ws@4413 threadName="vmx"] cap[194]: 0x000003f7 (DXFMT_R8_SNORM)
2025-12-14T09:04:59.027Z -INFO vmware-vmx.exe 22116 [ws@4413 threadName="vmx"] cap[195]: 0x000003e7 (DXFMT_R8_SINT)
2025-12-14T09:04:59.027Z -INFO vmware-vmx.exe 22116 [ws@4413 threadName="vmx"] cap[196]: 0x00000001 (DXFMT_P8)
2025-12-14T09:04:59.027Z -INFO vmware-vmx.exe 22116 [ws@4413 threadName="vmx"] cap[197]: 0x000000e3 (DXFMT_R9G9B9E5_SHAREDEXP)
2025-12-14T09:04:59.027Z -INFO vmware-vmx.exe 22116 [ws@4413 threadName="vmx"] cap[198]: 0x000000e3 (DXFMT_R8G8_B8G8_UNORM)
2025-12-14T09:04:59.027Z -INFO vmware-vmx.exe 22116 [ws@4413 threadName="vmx"] cap[199]: 0x000000e3 (DXFMT_G8R8_G8B8_UNORM)
2025-12-14T09:04:59.027Z -INFO vmware-vmx.exe 22116 [ws@4413 threadName="vmx"] cap[200]: 0x000000e1 (DXFMT_BC1_TYPELESS)
2025-12-14T09:04:59.027Z -INFO vmware-vmx.exe 22116 [ws@4413 threadName="vmx"] cap[201]: 0x000000e3 (DXFMT_BC1_UNORM_SRGB)
2025-12-14T09:04:59.027Z -INFO vmware-vmx.exe 22116 [ws@4413 threadName="vmx"] cap[202]: 0x000000e1 (DXFMT_BC2_TYPELESS)
2025-12-14T09:04:59.027Z -INFO vmware-vmx.exe 22116 [ws@4413 threadName="vmx"] cap[203]: 0x000000e3 (DXFMT_BC2_UNORM_SRGB)
2025-12-14T09:04:59.027Z -INFO vmware-vmx.exe 22116 [ws@4413 threadName="vmx"] cap[204]: 0x000000e1 (DXFMT_BC3_TYPELESS)
2025-12-14T09:04:59.027Z -INFO vmware-vmx.exe 22116 [ws@4413 threadName="vmx"] cap[205]: 0x000000e3 (DXFMT_BC3_UNORM_SRGB)
2025-12-14T09:04:59.027Z -INFO vmware-vmx.exe 22116 [ws@4413 threadName="vmx"] cap[206]: 0x000000e1 (DXFMT_BC4_TYPELESS)
2025-12-14T09:04:59.027Z -INFO vmware-vmx.exe 22116 [ws@4413 threadName="vmx"] cap[207]: 0x00000063 (DXFMT_ATI1)
2025-12-14T09:04:59.027Z -INFO vmware-vmx.exe 22116 [ws@4413 threadName="vmx"] cap[208]: 0x000000e3 (DXFMT_BC4_SNORM)
2025-12-14T09:04:59.027Z -INFO vmware-vmx.exe 22116 [ws@4413 threadName="vmx"] cap[209]: 0x000000e1 (DXFMT_BC5_TYPELESS)
2025-12-14T09:04:59.027Z -INFO vmware-vmx.exe 22116 [ws@4413 threadName="vmx"] cap[210]: 0x00000063 (DXFMT_ATI2)
2025-12-14T09:04:59.027Z -INFO vmware-vmx.exe 22116 [ws@4413 threadName="vmx"] cap[211]: 0x000000e3 (DXFMT_BC5_SNORM)
2025-12-14T09:04:59.027Z -INFO vmware-vmx.exe 22116 [ws@4413 threadName="vmx"] cap[212]: 0x00000045 (DXFMT_R10G10B10_XR_BIAS_A2_UNORM)
2025-12-14T09:04:59.027Z -INFO vmware-vmx.exe 22116 [ws@4413 threadName="vmx"] cap[213]: 0x000002e1 (DXFMT_B8G8R8A8_TYPELESS)
2025-12-14T09:04:59.027Z -INFO vmware-vmx.exe 22116 [ws@4413 threadName="vmx"] cap[214]: 0x000002f7 (DXFMT_B8G8R8A8_UNORM_SRGB)
2025-12-14T09:04:59.027Z -INFO vmware-vmx.exe 22116 [ws@4413 threadName="vmx"] cap[215]: 0x000002e1 (DXFMT_B8G8R8X8_TYPELESS)
2025-12-14T09:04:59.027Z -INFO vmware-vmx.exe 22116 [ws@4413 threadName="vmx"] cap[216]: 0x000002f7 (DXFMT_B8G8R8X8_UNORM_SRGB)
2025-12-14T09:04:59.027Z -INFO vmware-vmx.exe 22116 [ws@4413 threadName="vmx"] cap[217]: 0x0000006b (DXFMT_Z_DF16)
2025-12-14T09:04:59.027Z -INFO vmware-vmx.exe 22116 [ws@4413 threadName="vmx"] cap[218]: 0x0000006b (DXFMT_Z_DF24)
2025-12-14T09:04:59.027Z -INFO vmware-vmx.exe 22116 [ws@4413 threadName="vmx"] cap[219]: 0x0000006b (DXFMT_Z_D24S8_INT)
2025-12-14T09:04:59.027Z -INFO vmware-vmx.exe 22116 [ws@4413 threadName="vmx"] cap[220]: 0x00000001 (DXFMT_YV12)
2025-12-14T09:04:59.027Z -INFO vmware-vmx.exe 22116 [ws@4413 threadName="vmx"] cap[221]: 0x000003f7 (DXFMT_R32G32B32A32_FLOAT)
2025-12-14T09:04:59.027Z -INFO vmware-vmx.exe 22116 [ws@4413 threadName="vmx"] cap[222]: 0x000003f7 (DXFMT_R16G16B16A16_FLOAT)
2025-12-14T09:04:59.027Z -INFO vmware-vmx.exe 22116 [ws@4413 threadName="vmx"] cap[223]: 0x000003f7 (DXFMT_R16G16B16A16_UNORM)
2025-12-14T09:04:59.027Z -INFO vmware-vmx.exe 22116 [ws@4413 threadName="vmx"] cap[224]: 0x000003f7 (DXFMT_R32G32_FLOAT)
2025-12-14T09:04:59.028Z -INFO vmware-vmx.exe 22116 [ws@4413 threadName="vmx"] cap[225]: 0x000003f7 (DXFMT_R10G10B10A2_UNORM)
2025-12-14T09:04:59.028Z -INFO vmware-vmx.exe 22116 [ws@4413 threadName="vmx"] cap[226]: 0x000003f7 (DXFMT_R8G8B8A8_SNORM)
2025-12-14T09:04:59.028Z -INFO vmware-vmx.exe 22116 [ws@4413 threadName="vmx"] cap[227]: 0x000003f7 (DXFMT_R16G16_FLOAT)
2025-12-14T09:04:59.028Z -INFO vmware-vmx.exe 22116 [ws@4413 threadName="vmx"] cap[228]: 0x000003f7 (DXFMT_R16G16_UNORM)
2025-12-14T09:04:59.028Z -INFO vmware-vmx.exe 22116 [ws@4413 threadName="vmx"] cap[229]: 0x000003f7 (DXFMT_R16G16_SNORM)
2025-12-14T09:04:59.028Z -INFO vmware-vmx.exe 22116 [ws@4413 threadName="vmx"] cap[230]: 0x000003f7 (DXFMT_R32_FLOAT)
2025-12-14T09:04:59.028Z -INFO vmware-vmx.exe 22116 [ws@4413 threadName="vmx"] cap[231]: 0x000003f7 (DXFMT_R8G8_SNORM)
2025-12-14T09:04:59.028Z -INFO vmware-vmx.exe 22116 [ws@4413 threadName="vmx"] cap[232]: 0x000003f7 (DXFMT_R16_FLOAT)
2025-12-14T09:04:59.028Z -INFO vmware-vmx.exe 22116 [ws@4413 threadName="vmx"] cap[233]: 0x00000269 (DXFMT_D16_UNORM)
2025-12-14T09:04:59.028Z -INFO vmware-vmx.exe 22116 [ws@4413 threadName="vmx"] cap[234]: 0x000002f7 (DXFMT_A8_UNORM)
2025-12-14T09:04:59.028Z -INFO vmware-vmx.exe 22116 [ws@4413 threadName="vmx"] cap[235]: 0x000000e3 (DXFMT_BC1_UNORM)
2025-12-14T09:04:59.028Z -INFO vmware-vmx.exe 22116 [ws@4413 threadName="vmx"] cap[236]: 0x000000e3 (DXFMT_BC2_UNORM)
2025-12-14T09:04:59.028Z -INFO vmware-vmx.exe 22116 [ws@4413 threadName="vmx"] cap[237]: 0x000000e3 (DXFMT_BC3_UNORM)
2025-12-14T09:04:59.028Z -INFO vmware-vmx.exe 22116 [ws@4413 threadName="vmx"] cap[238]: 0x000002f7 (DXFMT_B5G6R5_UNORM)
2025-12-14T09:04:59.028Z -INFO vmware-vmx.exe 22116 [ws@4413 threadName="vmx"] cap[239]: 0x000002f7 (DXFMT_B5G5R5A1_UNORM)
2025-12-14T09:04:59.028Z -INFO vmware-vmx.exe 22116 [ws@4413 threadName="vmx"] cap[240]: 0x000003f7 (DXFMT_B8G8R8A8_UNORM)
2025-12-14T09:04:59.028Z -INFO vmware-vmx.exe 22116 [ws@4413 threadName="vmx"] cap[241]: 0x000003f7 (DXFMT_B8G8R8X8_UNORM)
2025-12-14T09:04:59.028Z -INFO vmware-vmx.exe 22116 [ws@4413 threadName="vmx"] cap[242]: 0x000000e3 (DXFMT_BC4_UNORM)
2025-12-14T09:04:59.028Z -INFO vmware-vmx.exe 22116 [ws@4413 threadName="vmx"] cap[243]: 0x000000e3 (DXFMT_BC5_UNORM)
2025-12-14T09:04:59.028Z -INFO vmware-vmx.exe 22116 [ws@4413 threadName="vmx"] cap[244]: 0x00000001 (SM41)
2025-12-14T09:04:59.028Z -INFO vmware-vmx.exe 22116 [ws@4413 threadName="vmx"] cap[245]: 0x00000001 (MULTISAMPLE_2X)
2025-12-14T09:04:59.028Z -INFO vmware-vmx.exe 22116 [ws@4413 threadName="vmx"] cap[246]: 0x00000001 (MULTISAMPLE_4X)
2025-12-14T09:04:59.028Z -INFO vmware-vmx.exe 22116 [ws@4413 threadName="vmx"] cap[247]: 0x00000001 (MS_FULL_QUALITY)
2025-12-14T09:04:59.028Z -INFO vmware-vmx.exe 22116 [ws@4413 threadName="vmx"] cap[248]: 0x00000001 (LOGICOPS)
2025-12-14T09:04:59.028Z -INFO vmware-vmx.exe 22116 [ws@4413 threadName="vmx"] cap[249]: 0x00000000 (LOGIC_BLENDOPS)
2025-12-14T09:04:59.028Z -INFO vmware-vmx.exe 22116 [ws@4413 threadName="vmx"] cap[250]: 0x00000000 (DEAD12)
2025-12-14T09:04:59.028Z -INFO vmware-vmx.exe 22116 [ws@4413 threadName="vmx"] cap[251]: 0x00000000 (DXFMT_BC6H_TYPELESS)
2025-12-14T09:04:59.028Z -INFO vmware-vmx.exe 22116 [ws@4413 threadName="vmx"] cap[252]: 0x00000000 (DXFMT_BC6H_UF16)
2025-12-14T09:04:59.028Z -INFO vmware-vmx.exe 22116 [ws@4413 threadName="vmx"] cap[253]: 0x00000000 (DXFMT_BC6H_SF16)
2025-12-14T09:04:59.028Z -INFO vmware-vmx.exe 22116 [ws@4413 threadName="vmx"] cap[254]: 0x00000000 (DXFMT_BC7_TYPELESS)
2025-12-14T09:04:59.028Z -INFO vmware-vmx.exe 22116 [ws@4413 threadName="vmx"] cap[255]: 0x00000000 (DXFMT_BC7_UNORM)
2025-12-14T09:04:59.028Z -INFO vmware-vmx.exe 22116 [ws@4413 threadName="vmx"] cap[256]: 0x00000000 (DXFMT_BC7_UNORM_SRGB)
2025-12-14T09:04:59.028Z -INFO vmware-vmx.exe 22116 [ws@4413 threadName="vmx"] cap[257]: 0x00000000 (DEAD13)
2025-12-14T09:04:59.028Z -INFO vmware-vmx.exe 22116 [ws@4413 threadName="vmx"] cap[258]: 0x00000000 (SM5)
2025-12-14T09:04:59.028Z -INFO vmware-vmx.exe 22116 [ws@4413 threadName="vmx"] cap[259]: 0x00000000 (MULTISAMPLE_8X)
2025-12-14T09:04:59.028Z -INFO vmware-vmx.exe 22116 [ws@4413 threadName="vmx"] cap[260]: 0x00000000 (MAX_FORCED_SAMPLE_COUNT)
2025-12-14T09:04:59.028Z -INFO vmware-vmx.exe 22116 [ws@4413 threadName="vmx"] cap[261]: 0x00000000 (GL43)
2025-12-14T09:04:59.028Z -INFO vmware-vmx.exe 22116 [ws@4413 threadName="vmx"] SVGA3dClamp: Host Provides BC67Level: 0 ( 0, 0)
2025-12-14T09:04:59.028Z -INFO vmware-vmx.exe 22116 [ws@4413 threadName="vmx"] SVGA3dClamp: Host Provides BaseCapsLevel: 9 ( 9, 9)
2025-12-14T09:04:59.028Z -INFO vmware-vmx.exe 22116 [ws@4413 threadName="vmx"] SVGA3dClamp: Host Provides ClampLevel: 0 ( 0, 9)
2025-12-14T09:04:59.028Z -INFO vmware-vmx.exe 22116 [ws@4413 threadName="vmx"] SVGA3dCaps: guest, compatSSlity level: 8
2025-12-14T09:04:59.028Z -INFO vmware-vmx.exe 22116 [ws@4413 threadName="vmx"] cap[ 0]: 0x00000001 (3D)
2025-12-14T09:04:59.028Z -INFO vmware-vmx.exe 22116 [ws@4413 threadName="vmx"] cap[ 1]: 0x00000008 (MAX_LIGHTS)
2025-12-14T09:04:59.028Z -INFO vmware-vmx.exe 22116 [ws@4413 threadName="vmx"] cap[ 2]: 0x00000008 (MAX_TEXTURES)
2025-12-14T09:04:59.028Z -INFO vmware-vmx.exe 22116 [ws@4413 threadName="vmx"] cap[ 3]: 0x00000008 (MAX_CLIP_PLANES)
2025-12-14T09:04:59.028Z -INFO vmware-vmx.exe 22116 [ws@4413 threadName="vmx"] cap[ 4]: 0x00000007 (VERTEX_SHADER_VERSION)
2025-12-14T09:04:59.028Z -INFO vmware-vmx.exe 22116 [ws@4413 threadName="vmx"] cap[ 5]: 0x00000001 (VERTEX_SHADER)
2025-12-14T09:04:59.028Z -INFO vmware-vmx.exe 22116 [ws@4413 threadName="vmx"] cap[ 6]: 0x0000000d (FRAGMENT_SHADER_VERSION)
2025-12-14T09:04:59.028Z -INFO vmware-vmx.exe 22116 [ws@4413 threadName="vmx"] cap[ 7]: 0x00000001 (FRAGMENT_SHADER)
2025-12-14T09:04:59.028Z -INFO vmware-vmx.exe 22116 [ws@4413 threadName="vmx"] cap[ 8]: 0x00000008 (MAX_RENDER_TARGETS)
2025-12-14T09:04:59.028Z -INFO vmware-vmx.exe 22116 [ws@4413 threadName="vmx"] cap[ 9]: 0x00000001 (S23E8_TEXTURES)
2025-12-14T09:04:59.028Z -INFO vmware-vmx.exe 22116 [ws@4413 threadName="vmx"] cap[ 10]: 0x00000001 (S10E5_TEXTURES)
2025-12-14T09:04:59.028Z -INFO vmware-vmx.exe 22116 [ws@4413 threadName="vmx"] cap[ 11]: 0x00000004 (MAX_FIXED_VERTEXBLEND)
2025-12-14T09:04:59.028Z -INFO vmware-vmx.exe 22116 [ws@4413 threadName="vmx"] cap[ 12]: 0x00000001 (D16_BUFFER_FORMAT)
2025-12-14T09:04:59.028Z -INFO vmware-vmx.exe 22116 [ws@4413 threadName="vmx"] cap[ 13]: 0x00000001 (D24S8_BUFFER_FORMAT)
2025-12-14T09:04:59.028Z -INFO vmware-vmx.exe 22116 [ws@4413 threadName="vmx"] cap[ 14]: 0x00000001 (D24X8_BUFFER_FORMAT)
2025-12-14T09:04:59.028Z -INFO vmware-vmx.exe 22116 [ws@4413 threadName="vmx"] cap[ 15]: 0x00000001 (QUERY_TYPES)
2025-12-14T09:04:59.028Z -INFO vmware-vmx.exe 22116 [ws@4413 threadName="vmx"] cap[ 16]: 0x00000001 (TEXTURE_GRADIENT_SAMPLING)
2025-12-14T09:04:59.028Z -INFO vmware-vmx.exe 22116 [ws@4413 threadName="vmx"] cap[ 17]: 1.000000 (MAX_POINT_SIZE)
2025-12-14T09:04:59.028Z -INFO vmware-vmx.exe 22116 [ws@4413 threadName="vmx"] cap[ 18]: 0x00000014 (MAX_SHADER_TEXTURES)
2025-12-14T09:04:59.028Z -INFO vmware-vmx.exe 22116 [ws@4413 threadName="vmx"] cap[ 19]: 0x00004000 (MAX_TEXTURE_WIDTH)
2025-12-14T09:04:59.028Z -INFO vmware-vmx.exe 22116 [ws@4413 threadName="vmx"] cap[ 20]: 0x00004000 (MAX_TEXTURE_HEIGHT)
2025-12-14T09:04:59.028Z -INFO vmware-vmx.exe 22116 [ws@4413 threadName="vmx"] cap[ 21]: 0x00000800 (MAX_VOLUME_EXTENT)
2025-12-14T09:04:59.028Z -INFO vmware-vmx.exe 22116 [ws@4413 threadName="vmx"] cap[ 22]: 0x00004000 (MAX_TEXTURE_REPEAT)
2025-12-14T09:04:59.028Z -INFO vmware-vmx.exe 22116 [ws@4413 threadName="vmx"] cap[ 23]: 0x00004000 (MAX_TEXTURE_ASPECT_RATIO)
2025-12-14T09:04:59.028Z -INFO vmware-vmx.exe 22116 [ws@4413 threadName="vmx"] cap[ 24]: 0x00000010 (MAX_TEXTURE_ANISOTROPY)
2025-12-14T09:04:59.028Z -INFO vmware-vmx.exe 22116 [ws@4413 threadName="vmx"] cap[ 25]: 0x001fffff (MAX_PRIMITIVE_COUNT)
2025-12-14T09:04:59.028Z -INFO vmware-vmx.exe 22116 [ws@4413 threadName="vmx"] cap[ 26]: 0x000fffff (MAX_VERTEX_INDEX)
2025-12-14T09:04:59.028Z -INFO vmware-vmx.exe 22116 [ws@4413 threadName="vmx"] cap[ 27]: 0x0000ffff (MAX_VERTEX_SHADER_INSTRUCTIONS)
2025-12-14T09:04:59.028Z -INFO vmware-vmx.exe 22116 [ws@4413 threadName="vmx"] cap[ 28]: 0x0000ffff (MAX_FRAGMENT_SHADER_INSTRUCTIONS)
2025-12-14T09:04:59.028Z -INFO vmware-vmx.exe 22116 [ws@4413 threadName="vmx"] cap[ 29]: 0x00000020 (MAX_VERTEX_SHADER_TEMPS)
2025-12-14T09:04:59.028Z -INFO vmware-vmx.exe 22116 [ws@4413 threadName="vmx"] cap[ 30]: 0x00000020 (MAX_FRAGMENT_SHADER_TEMPS)
2025-12-14T09:04:59.028Z -INFO vmware-vmx.exe 22116 [ws@4413 threadName="vmx"] cap[ 31]: 0x03ffffff (TEXTURE_OPS)
2025-12-14T09:04:59.028Z -INFO vmware-vmx.exe 22116 [ws@4413 threadName="vmx"] cap[ 32]: 0x0018ec1f (SURFACEFMT_X8R8G8B8)
2025-12-14T09:04:59.028Z -INFO vmware-vmx.exe 22116 [ws@4413 threadName="vmx"] cap[ 33]: 0x0018e11f (SURFACEFMT_A8R8G8B8)
2025-12-14T09:04:59.028Z -INFO vmware-vmx.exe 22116 [ws@4413 threadName="vmx"] cap[ 34]: 0x0008601f (SURFACEFMT_A2R10G10B10)
2025-12-14T09:04:59.028Z -INFO vmware-vmx.exe 22116 [ws@4413 threadName="vmx"] cap[ 35]: 0x0008601f (SURFACEFMT_X1R5G5B5)
2025-12-14T09:04:59.028Z -INFO vmware-vmx.exe 22116 [ws@4413 threadName="vmx"] cap[ 36]: 0x0008611f (SURFACEFMT_A1R5G5B5)
2025-12-14T09:04:59.028Z -INFO vmware-vmx.exe 22116 [ws@4413 threadName="vmx"] cap[ 37]: 0x0000611f (SURFACEFMT_A4R4G4B4)
2025-12-14T09:04:59.028Z -INFO vmware-vmx.exe 22116 [ws@4413 threadName="vmx"] cap[ 38]: 0x0018ec1f (SURFACEFMT_R5G6B5)
2025-12-14T09:04:59.028Z -INFO vmware-vmx.exe 22116 [ws@4413 threadName="vmx"] cap[ 39]: 0x0000601f (SURFACEFMT_LUMINANCE16)
2025-12-14T09:04:59.028Z -INFO vmware-vmx.exe 22116 [ws@4413 threadName="vmx"] cap[ 40]: 0x00006007 (SURFACEFMT_LUMINANCE8_ALPHA8)
2025-12-14T09:04:59.028Z -INFO vmware-vmx.exe 22116 [ws@4413 threadName="vmx"] cap[ 41]: 0x0000601f (SURFACEFMT_ALPHA8)
2025-12-14T09:04:59.028Z -INFO vmware-vmx.exe 22116 [ws@4413 threadName="vmx"] cap[ 42]: 0x0000601f (SURFACEFMT_LUMINANCE8)
2025-12-14T09:04:59.028Z -INFO vmware-vmx.exe 22116 [ws@4413 threadName="vmx"] cap[ 43]: 0x000040c5 (SURFACEFMT_Z_D16)
2025-12-14T09:04:59.028Z -INFO vmware-vmx.exe 22116 [ws@4413 threadName="vmx"] cap[ 44]: 0x000040c5 (SURFACEFMT_Z_D24S8)
2025-12-14T09:04:59.028Z -INFO vmware-vmx.exe 22116 [ws@4413 threadName="vmx"] cap[ 45]: 0x000040c5 (SURFACEFMT_Z_D24X8)
2025-12-14T09:04:59.028Z -INFO vmware-vmx.exe 22116 [ws@4413 threadName="vmx"] cap[ 46]: 0x0000e005 (SURFACEFMT_DXT1)
2025-12-14T09:04:59.028Z -INFO vmware-vmx.exe 22116 [ws@4413 threadName="vmx"] cap[ 47]: 0x0000e005 (SURFACEFMT_DXT2)
2025-12-14T09:04:59.028Z -INFO vmware-vmx.exe 22116 [ws@4413 threadName="vmx"] cap[ 48]: 0x0000e005 (SURFACEFMT_DXT3)
2025-12-14T09:04:59.028Z -INFO vmware-vmx.exe 22116 [ws@4413 threadName="vmx"] cap[ 49]: 0x0000e005 (SURFACEFMT_DXT4)
2025-12-14T09:04:59.029Z -INFO vmware-vmx.exe 22116 [ws@4413 threadName="vmx"] cap[ 50]: 0x0000e005 (SURFACEFMT_DXT5)
2025-12-14T09:04:59.029Z -INFO vmware-vmx.exe 22116 [ws@4413 threadName="vmx"] cap[ 51]: 0x00014005 (SURFACEFMT_BUMPX8L8V8U8)
2025-12-14T09:04:59.029Z -INFO vmware-vmx.exe 22116 [ws@4413 threadName="vmx"] cap[ 52]: 0x00014007 (SURFACEFMT_A2W10V10U10)
2025-12-14T09:04:59.029Z -INFO vmware-vmx.exe 22116 [ws@4413 threadName="vmx"] cap[ 53]: 0x00014007 (SURFACEFMT_BUMPU8V8)
2025-12-14T09:04:59.029Z -INFO vmware-vmx.exe 22116 [ws@4413 threadName="vmx"] cap[ 54]: 0x00014005 (SURFACEFMT_Q8W8V8U8)
2025-12-14T09:04:59.029Z -INFO vmware-vmx.exe 22116 [ws@4413 threadName="vmx"] cap[ 55]: 0x00014001 (SURFACEFMT_CxV8U8)
2025-12-14T09:04:59.029Z -INFO vmware-vmx.exe 22116 [ws@4413 threadName="vmx"] cap[ 56]: 0x0080601f (SURFACEFMT_R_S10E5)
2025-12-14T09:04:59.029Z -INFO vmware-vmx.exe 22116 [ws@4413 threadName="vmx"] cap[ 57]: 0x0080601f (SURFACEFMT_R_S23E8)
2025-12-14T09:04:59.029Z -INFO vmware-vmx.exe 22116 [ws@4413 threadName="vmx"] cap[ 58]: 0x0080601f (SURFACEFMT_RG_S10E5)
2025-12-14T09:04:59.029Z -INFO vmware-vmx.exe 22116 [ws@4413 threadName="vmx"] cap[ 59]: 0x0080601f (SURFACEFMT_RG_S23E8)
2025-12-14T09:04:59.029Z -INFO vmware-vmx.exe 22116 [ws@4413 threadName="vmx"] cap[ 60]: 0x0080601f (SURFACEFMT_ARGB_S10E5)
2025-12-14T09:04:59.029Z -INFO vmware-vmx.exe 22116 [ws@4413 threadName="vmx"] cap[ 61]: 0x0080601f (SURFACEFMT_ARGB_S23E8)
2025-12-14T09:04:59.029Z -INFO vmware-vmx.exe 22116 [ws@4413 threadName="vmx"] cap[ 62]: 0x00000000 (MISSING62)
2025-12-14T09:04:59.029Z -INFO vmware-vmx.exe 22116 [ws@4413 threadName="vmx"] cap[ 63]: 0x00000004 (MAX_VERTEX_SHADER_TEXTURES)
2025-12-14T09:04:59.029Z -INFO vmware-vmx.exe 22116 [ws@4413 threadName="vmx"] cap[ 64]: 0x00000008 (MAX_SIMULTANEOUS_RENDER_TARGETS)
2025-12-14T09:04:59.029Z -INFO vmware-vmx.exe 22116 [ws@4413 threadName="vmx"] cap[ 65]: 0x00014007 (SURFACEFMT_V16U16)
2025-12-14T09:04:59.029Z -INFO vmware-vmx.exe 22116 [ws@4413 threadName="vmx"] cap[ 66]: 0x0000601f (SURFACEFMT_G16R16)
2025-12-14T09:04:59.029Z -INFO vmware-vmx.exe 22116 [ws@4413 threadName="vmx"] cap[ 67]: 0x0000601f (SURFACEFMT_A16B16G16R16)
2025-12-14T09:04:59.029Z -INFO vmware-vmx.exe 22116 [ws@4413 threadName="vmx"] cap[ 68]: 0x01246000 (SURFACEFMT_UYVY)
2025-12-14T09:04:59.029Z -INFO vmware-vmx.exe 22116 [ws@4413 threadName="vmx"] cap[ 69]: 0x01246000 (SURFACEFMT_YUY2)
2025-12-14T09:04:59.029Z -INFO vmware-vmx.exe 22116 [ws@4413 threadName="vmx"] cap[ 70]: 0x00000000 (DEAD4)
2025-12-14T09:04:59.029Z -INFO vmware-vmx.exe 22116 [ws@4413 threadName="vmx"] cap[ 71]: 0x00000000 (DEAD5)
2025-12-14T09:04:59.029Z -INFO vmware-vmx.exe 22116 [ws@4413 threadName="vmx"] cap[ 72]: 0x00000000 (DEAD7)
2025-12-14T09:04:59.029Z -INFO vmware-vmx.exe 22116 [ws@4413 threadName="vmx"] cap[ 73]: 0x00000000 (DEAD6)
2025-12-14T09:04:59.029Z -INFO vmware-vmx.exe 22116 [ws@4413 threadName="vmx"] cap[ 74]: 0x00000001 (AUTOGENMIPMAPS)
2025-12-14T09:04:59.029Z -INFO vmware-vmx.exe 22116 [ws@4413 threadName="vmx"] cap[ 75]: 0x01246000 (SURFACEFMT_NV12)
2025-12-14T09:04:59.029Z -INFO vmware-vmx.exe 22116 [ws@4413 threadName="vmx"] cap[ 76]: 0x00000000 (DEAD10)
2025-12-14T09:04:59.029Z -INFO vmware-vmx.exe 22116 [ws@4413 threadName="vmx"] cap[ 77]: 0x00000100 (MAX_CONTEXT_IDS)
2025-12-14T09:04:59.029Z -INFO vmware-vmx.exe 22116 [ws@4413 threadName="vmx"] cap[ 78]: 0x00008000 (MAX_SURFACE_IDS)
2025-12-14T09:04:59.029Z -INFO vmware-vmx.exe 22116 [ws@4413 threadName="vmx"] cap[ 79]: 0x000040c5 (SURFACEFMT_Z_DF16)
2025-12-14T09:04:59.029Z -INFO vmware-vmx.exe 22116 [ws@4413 threadName="vmx"] cap[ 80]: 0x000040c5 (SURFACEFMT_Z_DF24)
2025-12-14T09:04:59.029Z -INFO vmware-vmx.exe 22116 [ws@4413 threadName="vmx"] cap[ 81]: 0x000040c5 (SURFACEFMT_Z_D24S8_INT)
2025-12-14T09:04:59.029Z -INFO vmware-vmx.exe 22116 [ws@4413 threadName="vmx"] cap[ 82]: 0x00006005 (SURFACEFMT_ATI1)
2025-12-14T09:04:59.029Z -INFO vmware-vmx.exe 22116 [ws@4413 threadName="vmx"] cap[ 83]: 0x00006005 (SURFACEFMT_ATI2)
2025-12-14T09:04:59.029Z -INFO vmware-vmx.exe 22116 [ws@4413 threadName="vmx"] cap[ 84]: 0x00000000 (DEAD1)
2025-12-14T09:04:59.029Z -INFO vmware-vmx.exe 22116 [ws@4413 threadName="vmx"] cap[ 85]: 0x00000000 (DEAD8)
2025-12-14T09:04:59.029Z -INFO vmware-vmx.exe 22116 [ws@4413 threadName="vmx"] cap[ 86]: 0x00000000 (DEAD9)
2025-12-14T09:04:59.029Z -INFO vmware-vmx.exe 22116 [ws@4413 threadName="vmx"] cap[ 87]: 0x00000001 (LINE_AA)
2025-12-14T09:04:59.029Z -INFO vmware-vmx.exe 22116 [ws@4413 threadName="vmx"] cap[ 88]: 0x00000000 (LINE_STIPPLE)
2025-12-14T09:04:59.029Z -INFO vmware-vmx.exe 22116 [ws@4413 threadName="vmx"] cap[ 89]: 10.000000 (MAX_LINE_WIDTH)
2025-12-14T09:04:59.029Z -INFO vmware-vmx.exe 22116 [ws@4413 threadName="vmx"] cap[ 90]: 10.000000 (MAX_AA_LINE_WIDTH)
2025-12-14T09:04:59.029Z -INFO vmware-vmx.exe 22116 [ws@4413 threadName="vmx"] cap[ 91]: 0x01246000 (SURFACEFMT_YV12)
2025-12-14T09:04:59.029Z -INFO vmware-vmx.exe 22116 [ws@4413 threadName="vmx"] cap[ 92]: 0x00000000 (DEAD3)
2025-12-14T09:04:59.029Z -INFO vmware-vmx.exe 22116 [ws@4413 threadName="vmx"] cap[ 93]: 0x00000001 (TS_COLOR_KEY)
2025-12-14T09:04:59.029Z -INFO vmware-vmx.exe 22116 [ws@4413 threadName="vmx"] cap[ 94]: 0x00000000 (DEAD2)
2025-12-14T09:04:59.029Z -INFO vmware-vmx.exe 22116 [ws@4413 threadName="vmx"] cap[ 95]: 0x00000001 (DXCONTEXT)
2025-12-14T09:04:59.029Z -INFO vmware-vmx.exe 22116 [ws@4413 threadName="vmx"] cap[ 96]: 0x00000000 (DEAD11)
2025-12-14T09:04:59.029Z -INFO vmware-vmx.exe 22116 [ws@4413 threadName="vmx"] cap[ 97]: 0x00000010 (DX_MAX_VERTEXBUFFERS)
2025-12-14T09:04:59.029Z -INFO vmware-vmx.exe 22116 [ws@4413 threadName="vmx"] cap[ 98]: 0x0000000f (DX_MAX_CONSTANT_BUFFERS)
2025-12-14T09:04:59.029Z -INFO vmware-vmx.exe 22116 [ws@4413 threadName="vmx"] cap[ 99]: 0x00000000 (DX_PROVOKING_VERTEX)
2025-12-14T09:04:59.029Z -INFO vmware-vmx.exe 22116 [ws@4413 threadName="vmx"] cap[100]: 0x000002f7 (DXFMT_X8R8G8B8)
2025-12-14T09:04:59.029Z -INFO vmware-vmx.exe 22116 [ws@4413 threadName="vmx"] cap[101]: 0x000003f7 (DXFMT_A8R8G8B8)
2025-12-14T09:04:59.029Z -INFO vmware-vmx.exe 22116 [ws@4413 threadName="vmx"] cap[102]: 0x000002f7 (DXFMT_R5G6B5)
2025-12-14T09:04:59.029Z -INFO vmware-vmx.exe 22116 [ws@4413 threadName="vmx"] cap[103]: 0x000000f7 (DXFMT_X1R5G5B5)
2025-12-14T09:04:59.029Z -INFO vmware-vmx.exe 22116 [ws@4413 threadName="vmx"] cap[104]: 0x000000f7 (DXFMT_A1R5G5B5)
2025-12-14T09:04:59.029Z -INFO vmware-vmx.exe 22116 [ws@4413 threadName="vmx"] cap[105]: 0x000000f7 (DXFMT_A4R4G4B4)
2025-12-14T09:04:59.029Z -INFO vmware-vmx.exe 22116 [ws@4413 threadName="vmx"] cap[106]: 0x00000009 (DXFMT_Z_D32)
2025-12-14T09:04:59.029Z -INFO vmware-vmx.exe 22116 [ws@4413 threadName="vmx"] cap[107]: 0x0000026b (DXFMT_Z_D16)
2025-12-14T09:04:59.029Z -INFO vmware-vmx.exe 22116 [ws@4413 threadName="vmx"] cap[108]: 0x0000026b (DXFMT_Z_D24S8)
2025-12-14T09:04:59.029Z -INFO vmware-vmx.exe 22116 [ws@4413 threadName="vmx"] cap[109]: 0x0000000b (DXFMT_Z_D15S1)
2025-12-14T09:04:59.029Z -INFO vmware-vmx.exe 22116 [ws@4413 threadName="vmx"] cap[110]: 0x000000f7 (DXFMT_LUMINANCE8)
2025-12-14T09:04:59.029Z -INFO vmware-vmx.exe 22116 [ws@4413 threadName="vmx"] cap[111]: 0x000000e3 (DXFMT_LUMINANCE4_ALPHA4)
2025-12-14T09:04:59.029Z -INFO vmware-vmx.exe 22116 [ws@4413 threadName="vmx"] cap[112]: 0x000000f7 (DXFMT_LUMINANCE16)
2025-12-14T09:04:59.029Z -INFO vmware-vmx.exe 22116 [ws@4413 threadName="vmx"] cap[113]: 0x000000e3 (DXFMT_LUMINANCE8_ALPHA8)
2025-12-14T09:04:59.029Z -INFO vmware-vmx.exe 22116 [ws@4413 threadName="vmx"] cap[114]: 0x00000063 (DXFMT_DXT1)
2025-12-14T09:04:59.029Z -INFO vmware-vmx.exe 22116 [ws@4413 threadName="vmx"] cap[115]: 0x00000063 (DXFMT_DXT2)
2025-12-14T09:04:59.029Z -INFO vmware-vmx.exe 22116 [ws@4413 threadName="vmx"] cap[116]: 0x00000063 (DXFMT_DXT3)
2025-12-14T09:04:59.029Z -INFO vmware-vmx.exe 22116 [ws@4413 threadName="vmx"] cap[117]: 0x00000063 (DXFMT_DXT4)
2025-12-14T09:04:59.029Z -INFO vmware-vmx.exe 22116 [ws@4413 threadName="vmx"] cap[118]: 0x00000063 (DXFMT_DXT5)
2025-12-14T09:04:59.029Z -INFO vmware-vmx.exe 22116 [ws@4413 threadName="vmx"] cap[119]: 0x000000e3 (DXFMT_BUMPU8V8)
2025-12-14T09:04:59.029Z -INFO vmware-vmx.exe 22116 [ws@4413 threadName="vmx"] cap[120]: 0x00000000 (DXFMT_BUMPL6V5U5)
2025-12-14T09:04:59.029Z -INFO vmware-vmx.exe 22116 [ws@4413 threadName="vmx"] cap[121]: 0x00000063 (DXFMT_BUMPX8L8V8U8)
2025-12-14T09:04:59.029Z -INFO vmware-vmx.exe 22116 [ws@4413 threadName="vmx"] cap[122]: 0x00000000 (DXFMT_FORMAT_DEAD1)
2025-12-14T09:04:59.029Z -INFO vmware-vmx.exe 22116 [ws@4413 threadName="vmx"] cap[123]: 0x000003f7 (DXFMT_ARGB_S10E5)
2025-12-14T09:04:59.029Z -INFO vmware-vmx.exe 22116 [ws@4413 threadName="vmx"] cap[124]: 0x000003f7 (DXFMT_ARGB_S23E8)
2025-12-14T09:04:59.029Z -INFO vmware-vmx.exe 22116 [ws@4413 threadName="vmx"] cap[125]: 0x000003f7 (DXFMT_A2R10G10B10)
2025-12-14T09:04:59.029Z -INFO vmware-vmx.exe 22116 [ws@4413 threadName="vmx"] cap[126]: 0x000000e3 (DXFMT_V8U8)
2025-12-14T09:04:59.029Z -INFO vmware-vmx.exe 22116 [ws@4413 threadName="vmx"] cap[127]: 0x00000063 (DXFMT_Q8W8V8U8)
2025-12-14T09:04:59.029Z -INFO vmware-vmx.exe 22116 [ws@4413 threadName="vmx"] cap[128]: 0x00000063 (DXFMT_CxV8U8)
2025-12-14T09:04:59.029Z -INFO vmware-vmx.exe 22116 [ws@4413 threadName="vmx"] cap[129]: 0x000000e3 (DXFMT_X8L8V8U8)
2025-12-14T09:04:59.029Z -INFO vmware-vmx.exe 22116 [ws@4413 threadName="vmx"] cap[130]: 0x000000e3 (DXFMT_A2W10V10U10)
2025-12-14T09:04:59.029Z -INFO vmware-vmx.exe 22116 [ws@4413 threadName="vmx"] cap[131]: 0x000000f7 (DXFMT_ALPHA8)
2025-12-14T09:04:59.029Z -INFO vmware-vmx.exe 22116 [ws@4413 threadName="vmx"] cap[132]: 0x000003f7 (DXFMT_R_S10E5)
2025-12-14T09:04:59.029Z -INFO vmware-vmx.exe 22116 [ws@4413 threadName="vmx"] cap[133]: 0x000003f7 (DXFMT_R_S23E8)
2025-12-14T09:04:59.029Z -INFO vmware-vmx.exe 22116 [ws@4413 threadName="vmx"] cap[134]: 0x000003f7 (DXFMT_RG_S10E5)
2025-12-14T09:04:59.029Z -INFO vmware-vmx.exe 22116 [ws@4413 threadName="vmx"] cap[135]: 0x000003f7 (DXFMT_RG_S23E8)
2025-12-14T09:04:59.029Z -INFO vmware-vmx.exe 22116 [ws@4413 threadName="vmx"] cap[136]: 0x00000001 (DXFMT_BUFFER)
2025-12-14T09:04:59.029Z -INFO vmware-vmx.exe 22116 [ws@4413 threadName="vmx"] cap[137]: 0x0000026b (DXFMT_Z_D24X8)
2025-12-14T09:04:59.029Z -INFO vmware-vmx.exe 22116 [ws@4413 threadName="vmx"] cap[138]: 0x000001e3 (DXFMT_V16U16)
2025-12-14T09:04:59.029Z -INFO vmware-vmx.exe 22116 [ws@4413 threadName="vmx"] cap[139]: 0x000003f7 (DXFMT_G16R16)
2025-12-14T09:04:59.029Z -INFO vmware-vmx.exe 22116 [ws@4413 threadName="vmx"] cap[140]: 0x000001f7 (DXFMT_A16B16G16R16)
2025-12-14T09:04:59.029Z -INFO vmware-vmx.exe 22116 [ws@4413 threadName="vmx"] cap[141]: 0x00000001 (DXFMT_UYVY)
2025-12-14T09:04:59.029Z -INFO vmware-vmx.exe 22116 [ws@4413 threadName="vmx"] cap[142]: 0x00000001 (DXFMT_YUY2)
2025-12-14T09:04:59.029Z -INFO vmware-vmx.exe 22116 [ws@4413 threadName="vmx"] cap[143]: 0x00000001 (DXFMT_NV12)
2025-12-14T09:04:59.029Z -INFO vmware-vmx.exe 22116 [ws@4413 threadName="vmx"] cap[144]: 0x00000000 (DXFMT_FORMAT_DEAD2)
2025-12-14T09:04:59.029Z -INFO vmware-vmx.exe 22116 [ws@4413 threadName="vmx"] cap[145]: 0x000002e1 (DXFMT_R32G32B32A32_TYPELESS)
2025-12-14T09:04:59.029Z -INFO vmware-vmx.exe 22116 [ws@4413 threadName="vmx"] cap[146]: 0x000003e7 (DXFMT_R32G32B32A32_UINT)
2025-12-14T09:04:59.029Z -INFO vmware-vmx.exe 22116 [ws@4413 threadName="vmx"] cap[147]: 0x000003e7 (DXFMT_R32G32B32A32_SINT)
2025-12-14T09:04:59.029Z -INFO vmware-vmx.exe 22116 [ws@4413 threadName="vmx"] cap[148]: 0x000000e1 (DXFMT_R32G32B32_TYPELESS)
2025-12-14T09:04:59.029Z -INFO vmware-vmx.exe 22116 [ws@4413 threadName="vmx"] cap[149]: 0x000001e3 (DXFMT_R32G32B32_FLOAT)
2025-12-14T09:04:59.029Z -INFO vmware-vmx.exe 22116 [ws@4413 threadName="vmx"] cap[150]: 0x000001e3 (DXFMT_R32G32B32_UINT)
2025-12-14T09:04:59.029Z -INFO vmware-vmx.exe 22116 [ws@4413 threadName="vmx"] cap[151]: 0x000001e3 (DXFMT_R32G32B32_SINT)
2025-12-14T09:04:59.029Z -INFO vmware-vmx.exe 22116 [ws@4413 threadName="vmx"] cap[152]: 0x000002e1 (DXFMT_R16G16B16A16_TYPELESS)
2025-12-14T09:04:59.029Z -INFO vmware-vmx.exe 22116 [ws@4413 threadName="vmx"] cap[153]: 0x000003e7 (DXFMT_R16G16B16A16_UINT)
2025-12-14T09:04:59.029Z -INFO vmware-vmx.exe 22116 [ws@4413 threadName="vmx"] cap[154]: 0x000003f7 (DXFMT_R16G16B16A16_SNORM)
2025-12-14T09:04:59.029Z -INFO vmware-vmx.exe 22116 [ws@4413 threadName="vmx"] cap[155]: 0x000003e7 (DXFMT_R16G16B16A16_SINT)
2025-12-14T09:04:59.029Z -INFO vmware-vmx.exe 22116 [ws@4413 threadName="vmx"] cap[156]: 0x000002e1 (DXFMT_R32G32_TYPELESS)
2025-12-14T09:04:59.029Z -INFO vmware-vmx.exe 22116 [ws@4413 threadName="vmx"] cap[157]: 0x000003e7 (DXFMT_R32G32_UINT)
2025-12-14T09:04:59.029Z -INFO vmware-vmx.exe 22116 [ws@4413 threadName="vmx"] cap[158]: 0x000003e7 (DXFMT_R32G32_SINT)
2025-12-14T09:04:59.029Z -INFO vmware-vmx.exe 22116 [ws@4413 threadName="vmx"] cap[159]: 0x00000261 (DXFMT_R32G8X24_TYPELESS)
2025-12-14T09:04:59.029Z -INFO vmware-vmx.exe 22116 [ws@4413 threadName="vmx"] cap[160]: 0x00000269 (DXFMT_D32_FLOAT_S8X24_UINT)
2025-12-14T09:04:59.030Z -INFO vmware-vmx.exe 22116 [ws@4413 threadName="vmx"] cap[161]: 0x00000063 (DXFMT_R32_FLOAT_X8X24)
2025-12-14T09:04:59.030Z -INFO vmware-vmx.exe 22116 [ws@4413 threadName="vmx"] cap[162]: 0x00000063 (DXFMT_X32_G8X24_UINT)
2025-12-14T09:04:59.030Z -INFO vmware-vmx.exe 22116 [ws@4413 threadName="vmx"] cap[163]: 0x000002e1 (DXFMT_R10G10B10A2_TYPELESS)
2025-12-14T09:04:59.030Z -INFO vmware-vmx.exe 22116 [ws@4413 threadName="vmx"] cap[164]: 0x000003e7 (DXFMT_R10G10B10A2_UINT)
2025-12-14T09:04:59.030Z -INFO vmware-vmx.exe 22116 [ws@4413 threadName="vmx"] cap[165]: 0x000003f7 (DXFMT_R11G11B10_FLOAT)
2025-12-14T09:04:59.030Z -INFO vmware-vmx.exe 22116 [ws@4413 threadName="vmx"] cap[166]: 0x000002e1 (DXFMT_R8G8B8A8_TYPELESS)
2025-12-14T09:04:59.030Z -INFO vmware-vmx.exe 22116 [ws@4413 threadName="vmx"] cap[167]: 0x000003f7 (DXFMT_R8G8B8A8_UNORM)
2025-12-14T09:04:59.030Z -INFO vmware-vmx.exe 22116 [ws@4413 threadName="vmx"] cap[168]: 0x000002f7 (DXFMT_R8G8B8A8_UNORM_SRGB)
2025-12-14T09:04:59.030Z -INFO vmware-vmx.exe 22116 [ws@4413 threadName="vmx"] cap[169]: 0x000003e7 (DXFMT_R8G8B8A8_UINT)
2025-12-14T09:04:59.030Z -INFO vmware-vmx.exe 22116 [ws@4413 threadName="vmx"] cap[170]: 0x000003e7 (DXFMT_R8G8B8A8_SINT)
2025-12-14T09:04:59.030Z -INFO vmware-vmx.exe 22116 [ws@4413 threadName="vmx"] cap[171]: 0x000002e1 (DXFMT_R16G16_TYPELESS)
2025-12-14T09:04:59.030Z -INFO vmware-vmx.exe 22116 [ws@4413 threadName="vmx"] cap[172]: 0x000003e7 (DXFMT_R16G16_UINT)
2025-12-14T09:04:59.030Z -INFO vmware-vmx.exe 22116 [ws@4413 threadName="vmx"] cap[173]: 0x000003e7 (DXFMT_R16G16_SINT)
2025-12-14T09:04:59.030Z -INFO vmware-vmx.exe 22116 [ws@4413 threadName="vmx"] cap[174]: 0x000002e1 (DXFMT_R32_TYPELESS)
2025-12-14T09:04:59.030Z -INFO vmware-vmx.exe 22116 [ws@4413 threadName="vmx"] cap[175]: 0x00000269 (DXFMT_D32_FLOAT)
2025-12-14T09:04:59.030Z -INFO vmware-vmx.exe 22116 [ws@4413 threadName="vmx"] cap[176]: 0x000003e7 (DXFMT_R32_UINT)
2025-12-14T09:04:59.030Z -INFO vmware-vmx.exe 22116 [ws@4413 threadName="vmx"] cap[177]: 0x000003e7 (DXFMT_R32_SINT)
2025-12-14T09:04:59.030Z -INFO vmware-vmx.exe 22116 [ws@4413 threadName="vmx"] cap[178]: 0x00000261 (DXFMT_R24G8_TYPELESS)
2025-12-14T09:04:59.030Z -INFO vmware-vmx.exe 22116 [ws@4413 threadName="vmx"] cap[179]: 0x00000269 (DXFMT_D24_UNORM_S8_UINT)
2025-12-14T09:04:59.030Z -INFO vmware-vmx.exe 22116 [ws@4413 threadName="vmx"] cap[180]: 0x00000063 (DXFMT_R24_UNORM_X8)
2025-12-14T09:04:59.030Z -INFO vmware-vmx.exe 22116 [ws@4413 threadName="vmx"] cap[181]: 0x00000063 (DXFMT_X24_G8_UINT)
2025-12-14T09:04:59.030Z -INFO vmware-vmx.exe 22116 [ws@4413 threadName="vmx"] cap[182]: 0x000002e1 (DXFMT_R8G8_TYPELESS)
2025-12-14T09:04:59.030Z -INFO vmware-vmx.exe 22116 [ws@4413 threadName="vmx"] cap[183]: 0x000003f7 (DXFMT_R8G8_UNORM)
2025-12-14T09:04:59.030Z -INFO vmware-vmx.exe 22116 [ws@4413 threadName="vmx"] cap[184]: 0x000003e7 (DXFMT_R8G8_UINT)
2025-12-14T09:04:59.030Z -INFO vmware-vmx.exe 22116 [ws@4413 threadName="vmx"] cap[185]: 0x000003e7 (DXFMT_R8G8_SINT)
2025-12-14T09:04:59.030Z -INFO vmware-vmx.exe 22116 [ws@4413 threadName="vmx"] cap[186]: 0x000002e1 (DXFMT_R16_TYPELESS)
2025-12-14T09:04:59.030Z -INFO vmware-vmx.exe 22116 [ws@4413 threadName="vmx"] cap[187]: 0x000003f7 (DXFMT_R16_UNORM)
2025-12-14T09:04:59.030Z -INFO vmware-vmx.exe 22116 [ws@4413 threadName="vmx"] cap[188]: 0x000003e7 (DXFMT_R16_UINT)
2025-12-14T09:04:59.030Z -INFO vmware-vmx.exe 22116 [ws@4413 threadName="vmx"] cap[189]: 0x000003f7 (DXFMT_R16_SNORM)
2025-12-14T09:04:59.030Z -INFO vmware-vmx.exe 22116 [ws@4413 threadName="vmx"] cap[190]: 0x000003e7 (DXFMT_R16_SINT)
2025-12-14T09:04:59.030Z -INFO vmware-vmx.exe 22116 [ws@4413 threadName="vmx"] cap[191]: 0x000002e1 (DXFMT_R8_TYPELESS)
2025-12-14T09:04:59.030Z -INFO vmware-vmx.exe 22116 [ws@4413 threadName="vmx"] cap[192]: 0x000003f7 (DXFMT_R8_UNORM)
2025-12-14T09:04:59.030Z -INFO vmware-vmx.exe 22116 [ws@4413 threadName="vmx"] cap[193]: 0x000003e7 (DXFMT_R8_UINT)
2025-12-14T09:04:59.030Z -INFO vmware-vmx.exe 22116 [ws@4413 threadName="vmx"] cap[194]: 0x000003f7 (DXFMT_R8_SNORM)
2025-12-14T09:04:59.030Z -INFO vmware-vmx.exe 22116 [ws@4413 threadName="vmx"] cap[195]: 0x000003e7 (DXFMT_R8_SINT)
2025-12-14T09:04:59.030Z -INFO vmware-vmx.exe 22116 [ws@4413 threadName="vmx"] cap[196]: 0x00000001 (DXFMT_P8)
2025-12-14T09:04:59.030Z -INFO vmware-vmx.exe 22116 [ws@4413 threadName="vmx"] cap[197]: 0x000000e3 (DXFMT_R9G9B9E5_SHAREDEXP)
2025-12-14T09:04:59.030Z -INFO vmware-vmx.exe 22116 [ws@4413 threadName="vmx"] cap[198]: 0x000000e3 (DXFMT_R8G8_B8G8_UNORM)
2025-12-14T09:04:59.030Z -INFO vmware-vmx.exe 22116 [ws@4413 threadName="vmx"] cap[199]: 0x000000e3 (DXFMT_G8R8_G8B8_UNORM)
2025-12-14T09:04:59.030Z -INFO vmware-vmx.exe 22116 [ws@4413 threadName="vmx"] cap[200]: 0x000000e1 (DXFMT_BC1_TYPELESS)
2025-12-14T09:04:59.030Z -INFO vmware-vmx.exe 22116 [ws@4413 threadName="vmx"] cap[201]: 0x000000e3 (DXFMT_BC1_UNORM_SRGB)
2025-12-14T09:04:59.030Z -INFO vmware-vmx.exe 22116 [ws@4413 threadName="vmx"] cap[202]: 0x000000e1 (DXFMT_BC2_TYPELESS)
2025-12-14T09:04:59.030Z -INFO vmware-vmx.exe 22116 [ws@4413 threadName="vmx"] cap[203]: 0x000000e3 (DXFMT_BC2_UNORM_SRGB)
2025-12-14T09:04:59.030Z -INFO vmware-vmx.exe 22116 [ws@4413 threadName="vmx"] cap[204]: 0x000000e1 (DXFMT_BC3_TYPELESS)
2025-12-14T09:04:59.030Z -INFO vmware-vmx.exe 22116 [ws@4413 threadName="vmx"] cap[205]: 0x000000e3 (DXFMT_BC3_UNORM_SRGB)
2025-12-14T09:04:59.030Z -INFO vmware-vmx.exe 22116 [ws@4413 threadName="vmx"] cap[206]: 0x000000e1 (DXFMT_BC4_TYPELESS)
2025-12-14T09:04:59.030Z -INFO vmware-vmx.exe 22116 [ws@4413 threadName="vmx"] cap[207]: 0x00000063 (DXFMT_ATI1)
2025-12-14T09:04:59.030Z -INFO vmware-vmx.exe 22116 [ws@4413 threadName="vmx"] cap[208]: 0x000000e3 (DXFMT_BC4_SNORM)
2025-12-14T09:04:59.030Z -INFO vmware-vmx.exe 22116 [ws@4413 threadName="vmx"] cap[209]: 0x000000e1 (DXFMT_BC5_TYPELESS)
2025-12-14T09:04:59.030Z -INFO vmware-vmx.exe 22116 [ws@4413 threadName="vmx"] cap[210]: 0x00000063 (DXFMT_ATI2)
2025-12-14T09:04:59.030Z -INFO vmware-vmx.exe 22116 [ws@4413 threadName="vmx"] cap[211]: 0x000000e3 (DXFMT_BC5_SNORM)
2025-12-14T09:04:59.030Z -INFO vmware-vmx.exe 22116 [ws@4413 threadName="vmx"] cap[212]: 0x00000045 (DXFMT_R10G10B10_XR_BIAS_A2_UNORM)
2025-12-14T09:04:59.030Z -INFO vmware-vmx.exe 22116 [ws@4413 threadName="vmx"] cap[213]: 0x000002e1 (DXFMT_B8G8R8A8_TYPELESS)
2025-12-14T09:04:59.030Z -INFO vmware-vmx.exe 22116 [ws@4413 threadName="vmx"] cap[214]: 0x000002f7 (DXFMT_B8G8R8A8_UNORM_SRGB)
2025-12-14T09:04:59.030Z -INFO vmware-vmx.exe 22116 [ws@4413 threadName="vmx"] cap[215]: 0x000002e1 (DXFMT_B8G8R8X8_TYPELESS)
2025-12-14T09:04:59.030Z -INFO vmware-vmx.exe 22116 [ws@4413 threadName="vmx"] cap[216]: 0x000002f7 (DXFMT_B8G8R8X8_UNORM_SRGB)
2025-12-14T09:04:59.030Z -INFO vmware-vmx.exe 22116 [ws@4413 threadName="vmx"] cap[217]: 0x0000006b (DXFMT_Z_DF16)
2025-12-14T09:04:59.030Z -INFO vmware-vmx.exe 22116 [ws@4413 threadName="vmx"] cap[218]: 0x0000006b (DXFMT_Z_DF24)
2025-12-14T09:04:59.030Z -INFO vmware-vmx.exe 22116 [ws@4413 threadName="vmx"] cap[219]: 0x0000006b (DXFMT_Z_D24S8_INT)
2025-12-14T09:04:59.030Z -INFO vmware-vmx.exe 22116 [ws@4413 threadName="vmx"] cap[220]: 0x00000001 (DXFMT_YV12)
2025-12-14T09:04:59.030Z -INFO vmware-vmx.exe 22116 [ws@4413 threadName="vmx"] cap[221]: 0x000003f7 (DXFMT_R32G32B32A32_FLOAT)
2025-12-14T09:04:59.030Z -INFO vmware-vmx.exe 22116 [ws@4413 threadName="vmx"] cap[222]: 0x000003f7 (DXFMT_R16G16B16A16_FLOAT)
2025-12-14T09:04:59.030Z -INFO vmware-vmx.exe 22116 [ws@4413 threadName="vmx"] cap[223]: 0x000003f7 (DXFMT_R16G16B16A16_UNORM)
2025-12-14T09:04:59.030Z -INFO vmware-vmx.exe 22116 [ws@4413 threadName="vmx"] cap[224]: 0x000003f7 (DXFMT_R32G32_FLOAT)
2025-12-14T09:04:59.030Z -INFO vmware-vmx.exe 22116 [ws@4413 threadName="vmx"] cap[225]: 0x000003f7 (DXFMT_R10G10B10A2_UNORM)
2025-12-14T09:04:59.030Z -INFO vmware-vmx.exe 22116 [ws@4413 threadName="vmx"] cap[226]: 0x000003f7 (DXFMT_R8G8B8A8_SNORM)
2025-12-14T09:04:59.030Z -INFO vmware-vmx.exe 22116 [ws@4413 threadName="vmx"] cap[227]: 0x000003f7 (DXFMT_R16G16_FLOAT)
2025-12-14T09:04:59.030Z -INFO vmware-vmx.exe 22116 [ws@4413 threadName="vmx"] cap[228]: 0x000003f7 (DXFMT_R16G16_UNORM)
2025-12-14T09:04:59.030Z -INFO vmware-vmx.exe 22116 [ws@4413 threadName="vmx"] cap[229]: 0x000003f7 (DXFMT_R16G16_SNORM)
2025-12-14T09:04:59.030Z -INFO vmware-vmx.exe 22116 [ws@4413 threadName="vmx"] cap[230]: 0x000003f7 (DXFMT_R32_FLOAT)
2025-12-14T09:04:59.030Z -INFO vmware-vmx.exe 22116 [ws@4413 threadName="vmx"] cap[231]: 0x000003f7 (DXFMT_R8G8_SNORM)
2025-12-14T09:04:59.030Z -INFO vmware-vmx.exe 22116 [ws@4413 threadName="vmx"] cap[232]: 0x000003f7 (DXFMT_R16_FLOAT)
2025-12-14T09:04:59.030Z -INFO vmware-vmx.exe 22116 [ws@4413 threadName="vmx"] cap[233]: 0x00000269 (DXFMT_D16_UNORM)
2025-12-14T09:04:59.030Z -INFO vmware-vmx.exe 22116 [ws@4413 threadName="vmx"] cap[234]: 0x000002f7 (DXFMT_A8_UNORM)
2025-12-14T09:04:59.030Z -INFO vmware-vmx.exe 22116 [ws@4413 threadName="vmx"] cap[235]: 0x000000e3 (DXFMT_BC1_UNORM)
2025-12-14T09:04:59.030Z -INFO vmware-vmx.exe 22116 [ws@4413 threadName="vmx"] cap[236]: 0x000000e3 (DXFMT_BC2_UNORM)
2025-12-14T09:04:59.030Z -INFO vmware-vmx.exe 22116 [ws@4413 threadName="vmx"] cap[237]: 0x000000e3 (DXFMT_BC3_UNORM)
2025-12-14T09:04:59.030Z -INFO vmware-vmx.exe 22116 [ws@4413 threadName="vmx"] cap[238]: 0x000002f7 (DXFMT_B5G6R5_UNORM)
2025-12-14T09:04:59.030Z -INFO vmware-vmx.exe 22116 [ws@4413 threadName="vmx"] cap[239]: 0x000000f7 (DXFMT_B5G5R5A1_UNORM)
2025-12-14T09:04:59.030Z -INFO vmware-vmx.exe 22116 [ws@4413 threadName="vmx"] cap[240]: 0x000003f7 (DXFMT_B8G8R8A8_UNORM)
2025-12-14T09:04:59.030Z -INFO vmware-vmx.exe 22116 [ws@4413 threadName="vmx"] cap[241]: 0x000003f7 (DXFMT_B8G8R8X8_UNORM)
2025-12-14T09:04:59.030Z -INFO vmware-vmx.exe 22116 [ws@4413 threadName="vmx"] cap[242]: 0x000000e3 (DXFMT_BC4_UNORM)
2025-12-14T09:04:59.030Z -INFO vmware-vmx.exe 22116 [ws@4413 threadName="vmx"] cap[243]: 0x000000e3 (DXFMT_BC5_UNORM)
2025-12-14T09:04:59.030Z -INFO vmware-vmx.exe 22116 [ws@4413 threadName="vmx"] cap[244]: 0x00000001 (SM41)
2025-12-14T09:04:59.030Z -INFO vmware-vmx.exe 22116 [ws@4413 threadName="vmx"] cap[245]: 0x00000001 (MULTISAMPLE_2X)
2025-12-14T09:04:59.030Z -INFO vmware-vmx.exe 22116 [ws@4413 threadName="vmx"] cap[246]: 0x00000001 (MULTISAMPLE_4X)
2025-12-14T09:04:59.030Z -INFO vmware-vmx.exe 22116 [ws@4413 threadName="vmx"] SVGA3dClamp: Guest Requires BC67Level: 0 ( 0, 0)
2025-12-14T09:04:59.030Z -INFO vmware-vmx.exe 22116 [ws@4413 threadName="vmx"] SVGA3dClamp: Guest Requires BaseCapsLevel: 7 ( 7, 7)
2025-12-14T09:04:59.030Z -INFO vmware-vmx.exe 22116 [ws@4413 threadName="vmx"] SVGA3dClamp: Guest Requires ClampLevel: 8 ( 0, 8)
2025-12-14T09:04:59.031Z -INFO vmware-vmx.exe 22116 [ws@4413 threadName="vmx"] USB: Initializing 'UHCI' host controller.
2025-12-14T09:04:59.032Z -INFO vmware-vmx.exe 22116 [ws@4413 threadName="vmx"] Ethernet0 MAC Address: 00:0c:29:93:5d:93
2025-12-14T09:04:59.033Z -INFO vmware-vmx.exe 22116 [ws@4413 threadName="vmx"] USB: Initializing 'EHCI' host controller.
2025-12-14T09:04:59.034Z -INFO vmware-vmx.exe 22116 [ws@4413 threadName="vmx"] USB: Initializing 'xHCI' host controller.
2025-12-14T09:04:59.034Z -INFO vmware-vmx.exe 22116 [ws@4413 threadName="vmx"] USB: PowerOnCreateDevice 'usb_xhci:4' #4, found port 22000F6E5E8.
2025-12-14T09:04:59.034Z -NOTICE vmware-vmx.exe 22116 [ws@4413 threadName="vmx"] ConfigDB: Setting usb_xhci:4.present = "TRUE"
2025-12-14T09:04:59.034Z -NOTICE vmware-vmx.exe 22116 [ws@4413 threadName="vmx"] ConfigDB: Setting usb_xhci:4.deviceType = "hid"
2025-12-14T09:04:59.034Z -NOTICE vmware-vmx.exe 22116 [ws@4413 threadName="vmx"] ConfigDB: Setting usb_xhci:4.port = "4"
2025-12-14T09:04:59.034Z -NOTICE vmware-vmx.exe 22116 [ws@4413 threadName="vmx"] ConfigDB: Setting usb_xhci:4.parent = "-1"
2025-12-14T09:04:59.040Z -INFO vmware-vmx.exe 22116 [ws@4413 threadName="vmx"] USB: PowerOnCreateDevice 'usb_xhci:6' #6, found port 22000F6E658.
2025-12-14T09:04:59.040Z -NOTICE vmware-vmx.exe 22116 [ws@4413 threadName="vmx"] ConfigDB: Setting usb_xhci:6.speed = "2"
2025-12-14T09:04:59.041Z -INFO vmware-vmx.exe 22116 [ws@4413 threadName="vmx"] USB: PowerOnCreateDevice 'usb_xhci:7' #7, found port 22000F6E690.
2025-12-14T09:04:59.041Z -NOTICE vmware-vmx.exe 22116 [ws@4413 threadName="vmx"] ConfigDB: Setting usb_xhci:7.speed = "4"
2025-12-14T09:04:59.041Z -NOTICE vmware-vmx.exe 22116 [ws@4413 threadName="vmx"] ConfigDB: Setting vmci0.id = "-1449960045"
2025-12-14T09:04:59.049Z -WARNING vmware-vmx.exe 22116 [ws@4413 threadName="vmx"] Device sata0 configured to use lock chains but base supportin workerlib is disabled
2025-12-14T09:04:59.049Z -INFO vmware-vmx.exe 22116 [ws@4413 threadName="vmx"] AHCI:Successfully created adapter 'sata0' as num 0
2025-12-14T09:04:59.049Z -INFO vmware-vmx.exe 22116 [ws@4413 threadName="vmx"] SCSI DEVICE (sata0:1): Computed value of sata0:1.useBounceBuffers: default
2025-12-14T09:04:59.049Z -INFO vmware-vmx.exe 22116 [ws@4413 threadName="vmx"] DISKUTIL: sata0:1 : capacity=0 logical sector size=2048
2025-12-14T09:04:59.049Z -INFO vmware-vmx.exe 22116 [ws@4413 threadName="vmx"] DISKUTIL: sata0:1 : geometry=0/0/0
2025-12-14T09:04:59.049Z -INFO vmware-vmx.exe 22116 [ws@4413 threadName="vmx"] AHCI:Creating ATAPI CDROM on SATA adapter.
2025-12-14T09:04:59.049Z -INFO vmware-vmx.exe 22116 [ws@4413 threadName="vmx"] AHCI:Successfully created device: sata0:1
2025-12-14T09:04:59.051Z -INFO vmware-vmx.exe 22116 [ws@4413 threadName="vmx"] WORKER: Creating new group with maxThreads=1 (35)
2025-12-14T09:04:59.051Z -INFO vmware-vmx.exe 22116 [ws@4413 threadName="vmx"] DISKUTIL: scsi0:0 : max toolsVersion = 13313, type = 1
2025-12-14T09:04:59.051Z -INFO vmware-vmx.exe 22116 [ws@4413 threadName="vmx"] TOOLS setting legacy tools version to '13313' type 1, manifest status is 9
2025-12-14T09:04:59.051Z -INFO vmware-vmx.exe 22116 [ws@4413 threadName="vmx"] Tools: sending 'OS_PowerOn' (state = 3) state change request
2025-12-14T09:04:59.051Z -INFO vmware-vmx.exe 22116 [ws@4413 threadName="vmx"] Tools: Delaying state change request to state 3.
2025-12-14T09:04:59.052Z -INFO vmware-vmx.exe 22116 [ws@4413 threadName="vmx"] TOOLS INSTALL initializing state to IDLE on power on.
2025-12-14T09:04:59.052Z -INFO vmware-vmx.exe 22116 [ws@4413 threadName="vmx"] TOOLS INSTALL updating Rpc handlers registration.
2025-12-14T09:04:59.052Z -INFO vmware-vmx.exe 22116 [ws@4413 threadName="vmx"] TOOLS INSTALL register RPC: upgrader.setGuestFileRoot
2025-12-14T09:04:59.052Z -INFO vmware-vmx.exe 22116 [ws@4413 threadName="vmx"] TOOLS INSTALL register RPC: toolinstall.is_image_inserted
2025-12-14T09:04:59.052Z -INFO vmware-vmx.exe 22116 [ws@4413 threadName="vmx"] TOOLS INSTALL register RPC: toolinstall.installerActive
2025-12-14T09:04:59.052Z -INFO vmware-vmx.exe 22116 [ws@4413 threadName="vmx"] TOOLS INSTALL register RPC: guest.upgrader_send_cmd_line_args
2025-12-14T09:04:59.052Z -INFO vmware-vmx.exe 22116 [ws@4413 threadName="worker-21696"] ToolsISO: Refreshing imageName for 'windows9-64' (refreshCount=1, lastCount=1).
2025-12-14T09:04:59.052Z -INFO vmware-vmx.exe 22116 [ws@4413 threadName="vmx"] P9FS_PowerOn: 9PFS server is not enabled.
2025-12-14T09:04:59.052Z -INFO vmware-vmx.exe 22116 [ws@4413 threadName="vmx"] HgfsServerManagerVigorInit: Initialize: dev api
2025-12-14T09:04:59.052Z -INFO vmware-vmx.exe 22116 [ws@4413 threadName="vmx"] HgfsServer_InitState: initialized notification inactive.
2025-12-14T09:04:59.052Z -INFO vmware-vmx.exe 22116 [ws@4413 threadName="vmx"] HgfsServer_InitState: initialized threadpool active.
2025-12-14T09:04:59.052Z -INFO vmware-vmx.exe 22116 [ws@4413 threadName="worker-21696"] ToolsISO: open of C:\Program Files (x86)\VMware\VMware Workstation\isoimages_manifest.txt.sig failed: Could not find the file
2025-12-14T09:04:59.052Z -INFO vmware-vmx.exe 22116 [ws@4413 threadName="worker-21696"] ToolsISO: Unable to read signature file 'C:\Program Files (x86)\VMware\VMware Workstation\isoimages_manifest.txt.sig', ignoring.
2025-12-14T09:04:59.052Z -INFO vmware-vmx.exe 22116 [ws@4413 threadName="vmx"] HgfsChannelActivateChannel: HGFS [backdoor] channel ACTIVATED.
2025-12-14T09:04:59.052Z -INFO vmware-vmx.exe 22116 [ws@4413 threadName="vmx"] HgfsChannelActivateChannel: HGFS [vmci] channel ACTIVATED.
2025-12-14T09:04:59.053Z -INFO vmware-vmx.exe 22116 [ws@4413 threadName="vmx"] MKSBackdoor: Copy/paste enabled = 1
2025-12-14T09:04:59.053Z -INFO vmware-vmx.exe 22116 [ws@4413 threadName="vmx"] DEPLOYPKG: No pending deploy package name set
2025-12-14T09:04:59.053Z -INFO vmware-vmx.exe 22116 [ws@4413 threadName="worker-21696"] ToolsISO: Updated cached value for imageName to 'windows.iso'.
2025-12-14T09:04:59.053Z -INFO vmware-vmx.exe 22116 [ws@4413 threadName="worker-21696"] ToolsISO: Selected Tools ISO 'windows.iso' for 'windows9-64' guest.
2025-12-14T09:04:59.053Z -INFO vmware-vmx.exe 22116 [ws@4413 threadName="worker-21696"] GetHostManifests: Extracting C:\Users\mb\AppData\Local\Temp\vmware-edv\manifest.txt.21696.iso.shipped manifest file.
2025-12-14T09:04:59.053Z -INFO vmware-vmx.exe 22116 [ws@4413 threadName="worker-21696"] ToolsISO: open of C:\Program Files (x86)\VMware\VMware Workstation\windows.iso.sha failed: Could not find the file
2025-12-14T09:04:59.053Z -INFO vmware-vmx.exe 22116 [ws@4413 threadName="worker-21696"] ToolsISO: Unable to read hash file C:\Program Files (x86)\VMware\VMware Workstation\windows.iso.sha, ignoring.
2025-12-14T09:04:59.053Z -INFO vmware-vmx.exe 22116 [ws@4413 threadName="vmx"] DEPLOYPKG: ToolsDeployPkgPublishState: state=0, code=0, message=(null)
2025-12-14T09:04:59.053Z -INFO vmware-vmx.exe 22116 [ws@4413 threadName="worker-21696"] GetHostManifests: Done extracting the manifest file.
2025-12-14T09:04:59.053Z -INFO vmware-vmx.exe 22116 [ws@4413 threadName="worker-21696"] Win32U_GetFileAttributes: GetFileAttributesExW("C:\Program Files (x86)\VMware\VMware Workstation\windows_avr_manifest.txt", ...) failed, error: 2
2025-12-14T09:04:59.054Z -INFO vmware-vmx.exe 22116 [ws@4413 threadName="vmx"] MonPmc: ctrBase 0x4c1 selBase 0x186/1 PGC 1/1 SMM 1 drain 0 AMD 0
2025-12-14T09:04:59.054Z +INFO vmware-vmx.exe 22116 [ws@4413 threadName="vmx"] MonPmc: gen counters num: 4 width 48 write width 48
2025-12-14T09:04:59.054Z +INFO vmware-vmx.exe 22116 [ws@4413 threadName="vmx"] MonPmc: fix counters num: 3 width 48; version 4
2025-12-14T09:04:59.054Z +INFO vmware-vmx.exe 22116 [ws@4413 threadName="vmx"] MonPmc: unavailable counters: 0x8
2025-12-14T09:04:59.054Z -INFO vmware-vmx.exe 22116 [ws@4413 threadName="worker-21696"] Using ToolsMinVersion = 8384
2025-12-14T09:04:59.054Z -INFO vmware-vmx.exe 22116 [ws@4413 threadName="worker-21696"] Using ToolsMaxVersion = 13313
2025-12-14T09:04:59.054Z -INFO vmware-vmx.exe 22116 [ws@4413 threadName="worker-21696"] ToolsVersionGetStatusWorkerThread: Tools status 3 derived from environment
2025-12-14T09:04:59.055Z -NOTICE vmware-vmx.exe 22116 [ws@4413 threadName="vmx"] ConfigDB: Setting monitor.phys_bits_used = "43"
2025-12-14T09:04:59.055Z -INFO vmware-vmx.exe 22116 [ws@4413 threadName="vmx"] Full guest CPUID with differences from hostCPUID highlighted.
2025-12-14T09:04:59.055Z -INFO vmware-vmx.exe 22116 [ws@4413 threadName="vmx"] guest vs. host CPUID guest vendor: GenuineIntel
2025-12-14T09:04:59.055Z -INFO vmware-vmx.exe 22116 [ws@4413 threadName="vmx"] guest vs. host CPUID guest family: 0x6 model: 0x9e stepping: 0xa
2025-12-14T09:04:59.055Z -INFO vmware-vmx.exe 22116 [ws@4413 threadName="vmx"] guest vs. host CPUID guest codename: Coffee Lake-S/H
2025-12-14T09:04:59.055Z -INFO vmware-vmx.exe 22116 [ws@4413 threadName="vmx"] guest vs. host CPUID guest name: Intel(R) Core(TM) i7-8700 CPU @ 3.20GHz
2025-12-14T09:04:59.055Z -INFO vmware-vmx.exe 22116 [ws@4413 threadName="vmx"] guest vs. host CPUID level eaxIn, ecxIn: eax ebx ecx edx
2025-12-14T09:04:59.055Z -INFO vmware-vmx.exe 22116 [ws@4413 threadName="vmx"] guest vs. host CPUID guest level 00000000, 0: 0x00000016 0x756e6547 0x6c65746e 0x49656e69
2025-12-14T09:04:59.055Z -INFO vmware-vmx.exe 22116 [ws@4413 threadName="vmx"] guest vs. host CPUID guest level 00000001, 0: 0x000906ea 0x00020800 0xf7fa3203 0x1f8bfbff
2025-12-14T09:04:59.055Z -INFO vmware-vmx.exe 22116 [ws@4413 threadName="vmx"] guest vs. host CPUID *host level 00000001, 0: 0x000906ea 0x00100800 0x7ffafbff 0xbfebfbff
2025-12-14T09:04:59.055Z -INFO vmware-vmx.exe 22116 [ws@4413 threadName="vmx"] guest vs. host CPUID guest level 00000002, 0: 0x76036301 0x00f0b5ff 0x00000000 0x00c30000
2025-12-14T09:04:59.055Z -INFO vmware-vmx.exe 22116 [ws@4413 threadName="vmx"] guest vs. host CPUID guest level 00000004, 0: 0x04000121 0x01c0003f 0x0000003f 0x00000000
2025-12-14T09:04:59.055Z -INFO vmware-vmx.exe 22116 [ws@4413 threadName="vmx"] guest vs. host CPUID *host level 00000004, 0: 0x1c004121 0x01c0003f 0x0000003f 0x00000000
2025-12-14T09:04:59.055Z -INFO vmware-vmx.exe 22116 [ws@4413 threadName="vmx"] guest vs. host CPUID guest level 00000004, 1: 0x04000122 0x01c0003f 0x0000003f 0x00000000
2025-12-14T09:04:59.055Z -INFO vmware-vmx.exe 22116 [ws@4413 threadName="vmx"] guest vs. host CPUID *host level 00000004, 1: 0x1c004122 0x01c0003f 0x0000003f 0x00000000
2025-12-14T09:04:59.055Z -INFO vmware-vmx.exe 22116 [ws@4413 threadName="vmx"] guest vs. host CPUID guest level 00000004, 2: 0x04000143 0x00c0003f 0x000003ff 0x00000000
2025-12-14T09:04:59.055Z -INFO vmware-vmx.exe 22116 [ws@4413 threadName="vmx"] guest vs. host CPUID *host level 00000004, 2: 0x1c004143 0x00c0003f 0x000003ff 0x00000000
2025-12-14T09:04:59.055Z -INFO vmware-vmx.exe 22116 [ws@4413 threadName="vmx"] guest vs. host CPUID guest level 00000004, 3: 0x04004163 0x03c0003f 0x00002fff 0x00000006
2025-12-14T09:04:59.055Z -INFO vmware-vmx.exe 22116 [ws@4413 threadName="vmx"] guest vs. host CPUID *host level 00000004, 3: 0x1c03c163 0x03c0003f 0x00002fff 0x00000006
2025-12-14T09:04:59.055Z -INFO vmware-vmx.exe 22116 [ws@4413 threadName="vmx"] guest vs. host CPUID guest level 00000004, 4: 0x04000000 0x00000000 0x00000000 0x00000000
2025-12-14T09:04:59.055Z -INFO vmware-vmx.exe 22116 [ws@4413 threadName="vmx"] guest vs. host CPUID *host level 00000004, 4: 0x00000000 0x00000000 0x00000000 0x00000000
2025-12-14T09:04:59.055Z -INFO vmware-vmx.exe 22116 [ws@4413 threadName="vmx"] guest vs. host CPUID guest level 00000006, 0: 0x00000004 0x00000000 0x00000000 0x00000000
2025-12-14T09:04:59.055Z -INFO vmware-vmx.exe 22116 [ws@4413 threadName="vmx"] guest vs. host CPUID *host level 00000006, 0: 0x000027f7 0x00000002 0x00000009 0x00000000
2025-12-14T09:04:59.055Z -INFO vmware-vmx.exe 22116 [ws@4413 threadName="vmx"] guest vs. host CPUID guest level 00000007, 0: 0x00000000 0x009c27ab 0x00000000 0xbc000400
2025-12-14T09:04:59.055Z -INFO vmware-vmx.exe 22116 [ws@4413 threadName="vmx"] guest vs. host CPUID *host level 00000007, 0: 0x00000000 0x029c6fbf 0x40000000 0xbc002e00
2025-12-14T09:04:59.055Z -INFO vmware-vmx.exe 22116 [ws@4413 threadName="vmx"] guest vs. host CPUID guest level 0000000a, 0: 0x07300401 0x000000ff 0x00000000 0x00000000
2025-12-14T09:04:59.055Z -INFO vmware-vmx.exe 22116 [ws@4413 threadName="vmx"] guest vs. host CPUID *host level 0000000a, 0: 0x07300404 0x00000000 0x00000000 0x00000603
2025-12-14T09:04:59.055Z -INFO vmware-vmx.exe 22116 [ws@4413 threadName="vmx"] guest vs. host CPUID guest level 0000000b, 0: 0x00000000 0x00000001 0x00000100 0x00000000
2025-12-14T09:04:59.055Z -INFO vmware-vmx.exe 22116 [ws@4413 threadName="vmx"] guest vs. host CPUID *host level 0000000b, 0: 0x00000001 0x00000002 0x00000100 0x00000000
2025-12-14T09:04:59.055Z -INFO vmware-vmx.exe 22116 [ws@4413 threadName="vmx"] guest vs. host CPUID guest level 0000000b, 1: 0x00000001 0x00000002 0x00000201 0x00000000
2025-12-14T09:04:59.055Z -INFO vmware-vmx.exe 22116 [ws@4413 threadName="vmx"] guest vs. host CPUID *host level 0000000b, 1: 0x00000004 0x0000000c 0x00000201 0x00000000
2025-12-14T09:04:59.055Z -INFO vmware-vmx.exe 22116 [ws@4413 threadName="vmx"] guest vs. host CPUID guest level 0000000d, 0: 0x00000007 0x00000340 0x00000340 0x00000000
2025-12-14T09:04:59.055Z -INFO vmware-vmx.exe 22116 [ws@4413 threadName="vmx"] guest vs. host CPUID *host level 0000000d, 0: 0x0000001f 0x00000440 0x00000440 0x00000000
2025-12-14T09:04:59.055Z -INFO vmware-vmx.exe 22116 [ws@4413 threadName="vmx"] guest vs. host CPUID guest level 0000000d, 1: 0x0000000b 0x00000440 0x00000000 0x00000000
2025-12-14T09:04:59.055Z -INFO vmware-vmx.exe 22116 [ws@4413 threadName="vmx"] guest vs. host CPUID *host level 0000000d, 1: 0x0000000f 0x00000440 0x00000100 0x00000000
2025-12-14T09:04:59.055Z -INFO vmware-vmx.exe 22116 [ws@4413 threadName="vmx"] guest vs. host CPUID guest level 0000000d, 2: 0x00000100 0x00000240 0x00000000 0x00000000
2025-12-14T09:04:59.055Z -INFO vmware-vmx.exe 22116 [ws@4413 threadName="vmx"] guest vs. host CPUID guest level 00000014, 0: 0x00000000 0x00000000 0x00000000 0x00000000
2025-12-14T09:04:59.055Z -INFO vmware-vmx.exe 22116 [ws@4413 threadName="vmx"] guest vs. host CPUID *host level 00000014, 0: 0x00000001 0x0000000f 0x00000007 0x00000000
2025-12-14T09:04:59.055Z -INFO vmware-vmx.exe 22116 [ws@4413 threadName="vmx"] guest vs. host CPUID guest level 00000014, 1: 0x00000000 0x00000000 0x00000000 0x00000000
2025-12-14T09:04:59.055Z -INFO vmware-vmx.exe 22116 [ws@4413 threadName="vmx"] guest vs. host CPUID *host level 00000014, 1: 0x02490002 0x003f3fff 0x00000000 0x00000000
2025-12-14T09:04:59.055Z -INFO vmware-vmx.exe 22116 [ws@4413 threadName="vmx"] guest vs. host CPUID guest level 00000015, 0: 0x00000000 0x00000000 0x00000000 0x00000000
2025-12-14T09:04:59.055Z -INFO vmware-vmx.exe 22116 [ws@4413 threadName="vmx"] guest vs. host CPUID *host level 00000015, 0: 0x00000002 0x0000010a 0x00000000 0x00000000
2025-12-14T09:04:59.055Z -INFO vmware-vmx.exe 22116 [ws@4413 threadName="vmx"] guest vs. host CPUID guest level 00000016, 0: 0x00000000 0x00000000 0x00000000 0x00000000
2025-12-14T09:04:59.055Z -INFO vmware-vmx.exe 22116 [ws@4413 threadName="vmx"] guest vs. host CPUID *host level 00000016, 0: 0x00000c80 0x000011f8 0x00000064 0x00000000
2025-12-14T09:04:59.055Z -INFO vmware-vmx.exe 22116 [ws@4413 threadName="vmx"] guest vs. host CPUID guest level 40000000, 0: 0x40000010 0x61774d56 0x4d566572 0x65726177
2025-12-14T09:04:59.055Z -INFO vmware-vmx.exe 22116 [ws@4413 threadName="vmx"] guest vs. host CPUID guest level 40000001, 0: 0x31237648 0x00000000 0x00000000 0x00000000
2025-12-14T09:04:59.055Z -INFO vmware-vmx.exe 22116 [ws@4413 threadName="vmx"] guest vs. host CPUID guest level 40000003, 0: 0x00000a72 0x00000000 0x00000000 0x00000508
2025-12-14T09:04:59.055Z -INFO vmware-vmx.exe 22116 [ws@4413 threadName="vmx"] guest vs. host CPUID guest level 40000004, 0: 0x00000020 0x00000000 0x00000000 0x00000000
2025-12-14T09:04:59.055Z -INFO vmware-vmx.exe 22116 [ws@4413 threadName="vmx"] guest vs. host CPUID guest level 40000005, 0: 0xffffffff 0x00000000 0x00000000 0x00000000
2025-12-14T09:04:59.055Z -INFO vmware-vmx.exe 22116 [ws@4413 threadName="vmx"] guest vs. host CPUID guest level 40000010, 0: 0x0030b4c1 0x000101d0 0x00000000 0x00000000
2025-12-14T09:04:59.055Z -INFO vmware-vmx.exe 22116 [ws@4413 threadName="vmx"] guest vs. host CPUID guest level 80000000, 0: 0x80000008 0x00000000 0x00000000 0x00000000
2025-12-14T09:04:59.055Z -INFO vmware-vmx.exe 22116 [ws@4413 threadName="vmx"] guest vs. host CPUID guest level 80000001, 0: 0x00000000 0x00000000 0x00000121 0x2c100800
2025-12-14T09:04:59.055Z -INFO vmware-vmx.exe 22116 [ws@4413 threadName="vmx"] guest vs. host CPUID guest level 80000002, 0: 0x65746e49 0x2952286c 0x726f4320 0x4d542865
2025-12-14T09:04:59.055Z -INFO vmware-vmx.exe 22116 [ws@4413 threadName="vmx"] guest vs. host CPUID guest level 80000003, 0: 0x37692029 0x3037382d 0x50432030 0x20402055
2025-12-14T09:04:59.055Z -INFO vmware-vmx.exe 22116 [ws@4413 threadName="vmx"] guest vs. host CPUID guest level 80000004, 0: 0x30322e33 0x007a4847 0x00000000 0x00000000
2025-12-14T09:04:59.055Z -INFO vmware-vmx.exe 22116 [ws@4413 threadName="vmx"] guest vs. host CPUID guest level 80000006, 0: 0x00000000 0x00000000 0x01006040 0x00000000
2025-12-14T09:04:59.055Z -INFO vmware-vmx.exe 22116 [ws@4413 threadName="vmx"] guest vs. host CPUID guest level 80000007, 0: 0x00000000 0x00000000 0x00000000 0x00000100
2025-12-14T09:04:59.055Z -INFO vmware-vmx.exe 22116 [ws@4413 threadName="vmx"] guest vs. host CPUID guest level 80000008, 0: 0x0000302b 0x00000000 0x00000000 0x00000000
2025-12-14T09:04:59.055Z -INFO vmware-vmx.exe 22116 [ws@4413 threadName="vmx"] guest vs. host CPUID *host level 80000008, 0: 0x00003027 0x00000000 0x00000000 0x00000000
2025-12-14T09:04:59.056Z -INFO vmware-vmx.exe 22116 [ws@4413 threadName="vmx"] Minimum ucode level: 0x000000ec
2025-12-14T09:04:59.056Z -INFO vmware-vmx.exe 22116 [ws@4413 threadName="vmx"] VPMC: events will use hybrid freeze.
2025-12-14T09:04:59.056Z -INFO vmware-vmx.exe 22116 [ws@4413 threadName="vmx"] VPMC: gen counters: num 4 mask 0xffffffffffff
2025-12-14T09:04:59.056Z -INFO vmware-vmx.exe 22116 [ws@4413 threadName="vmx"] VPMC: fix counters: num 0 mask 0; version 1
2025-12-14T09:04:59.056Z -INFO vmware-vmx.exe 22116 [ws@4413 threadName="vmx"] VPMC: hardware counters: 0
2025-12-14T09:04:59.056Z -INFO vmware-vmx.exe 22116 [ws@4413 threadName="vmx"] VPMC: perf capabilities: 0x2000
2025-12-14T09:04:59.056Z -INFO vmware-vmx.exe 22116 [ws@4413 threadName="vmx"] Guest MSR IA32_ARCH_CAPABILITIES 0x10a = 0xc
2025-12-14T09:04:59.056Z -INFO vmware-vmx.exe 22116 [ws@4413 threadName="vmx"] SVGA-PCI: BAR gfbSize=134217728, fifoSize=8388608
2025-12-14T09:04:59.056Z -INFO vmware-vmx.exe 22116 [ws@4413 threadName="vmx"] SVGA: SVGA_REG_MEMORY_SIZE=4194304
2025-12-14T09:04:59.056Z -INFO vmware-vmx.exe 22116 [ws@4413 threadName="vmx"] SVGA: SVGA_REG_VRAM_SIZE=4194304
2025-12-14T09:04:59.056Z -INFO vmware-vmx.exe 22116 [ws@4413 threadName="vmx"] SVGA: Final Device caps : 0xfdffc3e2
2025-12-14T09:04:59.056Z -INFO vmware-vmx.exe 22116 [ws@4413 threadName="vmx"] SVGA: Final Device caps2: 0x00000007
2025-12-14T09:04:59.056Z -INFO vmware-vmx.exe 22116 [ws@4413 threadName="vmx"] BusMemSampleSetUpStats: touched: initPct 75 pages 1179648 : dirtied: initPct 75 pages 1179648
2025-12-14T09:04:59.056Z -INFO vmware-vmx.exe 22116 [ws@4413 threadName="vmx"] MemSched: caller 0 numvm 1 locked pages: num 3607 max 7264512
2025-12-14T09:04:59.056Z -INFO vmware-vmx.exe 22116 [ws@4413 threadName="vmx"] MemSched: locked Page Limit: host 7640249 config 7272704
2025-12-14T09:04:59.056Z -INFO vmware-vmx.exe 22116 [ws@4413 threadName="vmx"] MemSched: minmempct 50 timestamp 5610
2025-12-14T09:04:59.056Z -INFO vmware-vmx.exe 22116 [ws@4413 threadName="vmx"] MemSched: VM 0 min 802823 max 1589255 shares 1572864 paged 1330494 nonpaged 6293 anonymous 10098 locked 3607 touchedPct 75 dirtiedPct 75 timestamp 5610 vmResponsive is 1
2025-12-14T09:04:59.056Z -INFO vmware-vmx.exe 22116 [ws@4413 threadName="vmx"] MemSched: locked 3607 target 1589255 balloon 0 0 0 swapped 0 0 allocd 0 512 state 0 100
2025-12-14T09:04:59.056Z -INFO vmware-vmx.exe 22116 [ws@4413 threadName="vmx"] MemSched: states: 0 1 : 1 0 : 2 0 : 3 0
2025-12-14T09:04:59.056Z -INFO vmware-vmx.exe 22116 [ws@4413 threadName="vmx"] MemSched: Balloon enabled 1 guestType 0 maxSize 0
2025-12-14T09:04:59.056Z -INFO vmware-vmx.exe 22116 [ws@4413 threadName="vmx"] PStrIntern expansion: nBkts=256
2025-12-14T09:04:59.057Z -INFO vmware-vmx.exe 22116 [ws@4413 threadName="vmx"] FeatureCompat: Capabilities:
2025-12-14T09:04:59.057Z -INFO vmware-vmx.exe 22116 [ws@4413 threadName="vmx"] Capability Found: cpuid.sse3 = 1
2025-12-14T09:04:59.057Z -INFO vmware-vmx.exe 22116 [ws@4413 threadName="vmx"] Capability Found: cpuid.pclmulqdq = 1
2025-12-14T09:04:59.057Z -INFO vmware-vmx.exe 22116 [ws@4413 threadName="vmx"] Capability Found: cpuid.mwait = 1
2025-12-14T09:04:59.057Z -INFO vmware-vmx.exe 22116 [ws@4413 threadName="vmx"] Capability Found: cpuid.vmx = 1
2025-12-14T09:04:59.057Z -INFO vmware-vmx.exe 22116 [ws@4413 threadName="vmx"] Capability Found: cpuid.ssse3 = 1
2025-12-14T09:04:59.057Z -INFO vmware-vmx.exe 22116 [ws@4413 threadName="vmx"] Capability Found: cpuid.fma = 1
2025-12-14T09:04:59.057Z -INFO vmware-vmx.exe 22116 [ws@4413 threadName="vmx"] Capability Found: cpuid.cmpxchg16b = 1
2025-12-14T09:04:59.057Z -INFO vmware-vmx.exe 22116 [ws@4413 threadName="vmx"] Capability Found: cpuid.pcid = 1
2025-12-14T09:04:59.057Z -INFO vmware-vmx.exe 22116 [ws@4413 threadName="vmx"] Capability Found: cpuid.sse41 = 1
2025-12-14T09:04:59.057Z -INFO vmware-vmx.exe 22116 [ws@4413 threadName="vmx"] Capability Found: cpuid.sse42 = 1
2025-12-14T09:04:59.057Z -INFO vmware-vmx.exe 22116 [ws@4413 threadName="vmx"] Capability Found: cpuid.movbe = 1
2025-12-14T09:04:59.057Z -INFO vmware-vmx.exe 22116 [ws@4413 threadName="vmx"] Capability Found: cpuid.popcnt = 1
2025-12-14T09:04:59.057Z -INFO vmware-vmx.exe 22116 [ws@4413 threadName="vmx"] Capability Found: cpuid.aes = 1
2025-12-14T09:04:59.057Z -INFO vmware-vmx.exe 22116 [ws@4413 threadName="vmx"] Capability Found: cpuid.xsave = 1
2025-12-14T09:04:59.057Z -INFO vmware-vmx.exe 22116 [ws@4413 threadName="vmx"] Capability Found: cpuid.avx = 1
2025-12-14T09:04:59.057Z -INFO vmware-vmx.exe 22116 [ws@4413 threadName="vmx"] Capability Found: cpuid.f16c = 1
2025-12-14T09:04:59.057Z -INFO vmware-vmx.exe 22116 [ws@4413 threadName="vmx"] Capability Found: cpuid.rdrand = 1
2025-12-14T09:04:59.057Z -INFO vmware-vmx.exe 22116 [ws@4413 threadName="vmx"] Capability Found: cpuid.ds = 1
2025-12-14T09:04:59.057Z -INFO vmware-vmx.exe 22116 [ws@4413 threadName="vmx"] Capability Found: cpuid.ss = 1
2025-12-14T09:04:59.057Z -INFO vmware-vmx.exe 22116 [ws@4413 threadName="vmx"] Capability Found: cpuid.fsgsbase = 1
2025-12-14T09:04:59.057Z -INFO vmware-vmx.exe 22116 [ws@4413 threadName="vmx"] Capability Found: cpuid.bmi1 = 1
2025-12-14T09:04:59.057Z -INFO vmware-vmx.exe 22116 [ws@4413 threadName="vmx"] Capability Found: cpuid.avx2 = 1
2025-12-14T09:04:59.057Z -INFO vmware-vmx.exe 22116 [ws@4413 threadName="vmx"] Capability Found: cpuid.smep = 1
2025-12-14T09:04:59.057Z -INFO vmware-vmx.exe 22116 [ws@4413 threadName="vmx"] Capability Found: cpuid.bmi2 = 1
2025-12-14T09:04:59.057Z -INFO vmware-vmx.exe 22116 [ws@4413 threadName="vmx"] Capability Found: cpuid.enfstrg = 1
2025-12-14T09:04:59.057Z -INFO vmware-vmx.exe 22116 [ws@4413 threadName="vmx"] Capability Found: cpuid.invpcid = 1
2025-12-14T09:04:59.057Z -INFO vmware-vmx.exe 22116 [ws@4413 threadName="vmx"] Capability Found: cpuid.rtm = 1
2025-12-14T09:04:59.057Z -INFO vmware-vmx.exe 22116 [ws@4413 threadName="vmx"] Capability Found: cpuid.rdseed = 1
2025-12-14T09:04:59.057Z -INFO vmware-vmx.exe 22116 [ws@4413 threadName="vmx"] Capability Found: cpuid.adx = 1
2025-12-14T09:04:59.057Z -INFO vmware-vmx.exe 22116 [ws@4413 threadName="vmx"] Capability Found: cpuid.smap = 1
2025-12-14T09:04:59.057Z -INFO vmware-vmx.exe 22116 [ws@4413 threadName="vmx"] Capability Found: cpuid.clflushopt = 1
2025-12-14T09:04:59.057Z -INFO vmware-vmx.exe 22116 [ws@4413 threadName="vmx"] Capability Found: cpuid.mdclear = 1
2025-12-14T09:04:59.057Z -INFO vmware-vmx.exe 22116 [ws@4413 threadName="vmx"] Capability Found: cpuid.stibp = 1
2025-12-14T09:04:59.057Z -INFO vmware-vmx.exe 22116 [ws@4413 threadName="vmx"] Capability Found: cpuid.fcmd = 1
2025-12-14T09:04:59.057Z -INFO vmware-vmx.exe 22116 [ws@4413 threadName="vmx"] Capability Found: cpuid.ssbd = 1
2025-12-14T09:04:59.057Z -INFO vmware-vmx.exe 22116 [ws@4413 threadName="vmx"] Capability Found: cpuid.xcr0_master_sse = 1
2025-12-14T09:04:59.057Z -INFO vmware-vmx.exe 22116 [ws@4413 threadName="vmx"] Capability Found: cpuid.xcr0_master_ymm_h = 1
2025-12-14T09:04:59.057Z -INFO vmware-vmx.exe 22116 [ws@4413 threadName="vmx"] Capability Found: cpuid.xcr0_master_bndregs = 1
2025-12-14T09:04:59.057Z -INFO vmware-vmx.exe 22116 [ws@4413 threadName="vmx"] Capability Found: cpuid.xcr0_master_bndcsr = 1
2025-12-14T09:04:59.057Z -INFO vmware-vmx.exe 22116 [ws@4413 threadName="vmx"] Capability Found: cpuid.xsaveopt = 1
2025-12-14T09:04:59.057Z -INFO vmware-vmx.exe 22116 [ws@4413 threadName="vmx"] Capability Found: cpuid.xsavec = 1
2025-12-14T09:04:59.057Z -INFO vmware-vmx.exe 22116 [ws@4413 threadName="vmx"] Capability Found: cpuid.xgetbv_ecx1 = 1
2025-12-14T09:04:59.057Z -INFO vmware-vmx.exe 22116 [ws@4413 threadName="vmx"] Capability Found: cpuid.xsaves = 1
2025-12-14T09:04:59.057Z -INFO vmware-vmx.exe 22116 [ws@4413 threadName="vmx"] Capability Found: cpuid.lahf64 = 1
2025-12-14T09:04:59.057Z -INFO vmware-vmx.exe 22116 [ws@4413 threadName="vmx"] Capability Found: cpuid.abm = 1
2025-12-14T09:04:59.057Z -INFO vmware-vmx.exe 22116 [ws@4413 threadName="vmx"] Capability Found: cpuid.3dnprefetch = 1
2025-12-14T09:04:59.057Z -INFO vmware-vmx.exe 22116 [ws@4413 threadName="vmx"] Capability Found: cpuid.nx = 1
2025-12-14T09:04:59.057Z -INFO vmware-vmx.exe 22116 [ws@4413 threadName="vmx"] Capability Found: cpuid.pdpe1gb = 1
2025-12-14T09:04:59.057Z -INFO vmware-vmx.exe 22116 [ws@4413 threadName="vmx"] Capability Found: cpuid.rdtscp = 1
2025-12-14T09:04:59.057Z -INFO vmware-vmx.exe 22116 [ws@4413 threadName="vmx"] Capability Found: cpuid.lm = 1
2025-12-14T09:04:59.057Z -INFO vmware-vmx.exe 22116 [ws@4413 threadName="vmx"] Capability Found: cpuid.intel = 1
2025-12-14T09:04:59.057Z -INFO vmware-vmx.exe 22116 [ws@4413 threadName="vmx"] Capability Found: cpuid.ibrs = 1
2025-12-14T09:04:59.057Z -INFO vmware-vmx.exe 22116 [ws@4413 threadName="vmx"] Capability Found: cpuid.ibpb = 1
2025-12-14T09:04:59.057Z -INFO vmware-vmx.exe 22116 [ws@4413 threadName="vmx"] Capability Found: cpuid.mpx = 1
2025-12-14T09:04:59.057Z -INFO vmware-vmx.exe 22116 [ws@4413 threadName="vmx"] Capability Found: cpuid.hle = 1
2025-12-14T09:04:59.057Z -INFO vmware-vmx.exe 22116 [ws@4413 threadName="vmx"] Capability Found: hv.capable = 1
2025-12-14T09:04:59.057Z -INFO vmware-vmx.exe 22116 [ws@4413 threadName="vmx"] Capability Found: vt.realmode = 1
2025-12-14T09:04:59.057Z -INFO vmware-vmx.exe 22116 [ws@4413 threadName="vmx"] Capability Found: vt.mbx = 1
2025-12-14T09:04:59.057Z -INFO vmware-vmx.exe 22116 [ws@4413 threadName="vmx"] Capability Found: misc.cpuidfaulting = 1
2025-12-14T09:04:59.057Z -INFO vmware-vmx.exe 22116 [ws@4413 threadName="vmx"] Capability Found: vt.advexitinfo = 1
2025-12-14T09:04:59.057Z -INFO vmware-vmx.exe 22116 [ws@4413 threadName="vmx"] Capability Found: vt.eptad = 1
2025-12-14T09:04:59.057Z -INFO vmware-vmx.exe 22116 [ws@4413 threadName="vmx"] Capability Found: vt.ple = 1
2025-12-14T09:04:59.057Z -INFO vmware-vmx.exe 22116 [ws@4413 threadName="vmx"] Capability Found: vt.zeroinstlen = 1
2025-12-14T09:04:59.057Z -INFO vmware-vmx.exe 22116 [ws@4413 threadName="vmx"] Capability Found: vpmc.microarchitecture.skylake = 1
2025-12-14T09:04:59.057Z -INFO vmware-vmx.exe 22116 [ws@4413 threadName="vmx"] Capability Found: vpmc.numgenctrs = 4
2025-12-14T09:04:59.057Z -INFO vmware-vmx.exe 22116 [ws@4413 threadName="vmx"] Capability Found: vpmc.numfixedctrs = 3
2025-12-14T09:04:59.057Z -INFO vmware-vmx.exe 22116 [ws@4413 threadName="vmx"] Capability Found: vpmc.genwidth = 0x30
2025-12-14T09:04:59.057Z -INFO vmware-vmx.exe 22116 [ws@4413 threadName="vmx"] Capability Found: vpmc.fixedwidth = 0x30
2025-12-14T09:04:59.057Z -INFO vmware-vmx.exe 22116 [ws@4413 threadName="vmx"] Capability Found: vpmc.version = 4
2025-12-14T09:04:59.057Z -INFO vmware-vmx.exe 22116 [ws@4413 threadName="vmx"] Capability Found: vpmc.genctr.0 = 1
2025-12-14T09:04:59.057Z -INFO vmware-vmx.exe 22116 [ws@4413 threadName="vmx"] Capability Found: vpmc.genctr.1 = 1
2025-12-14T09:04:59.057Z -INFO vmware-vmx.exe 22116 [ws@4413 threadName="vmx"] Capability Found: vpmc.genctr.2 = 1
2025-12-14T09:04:59.057Z -INFO vmware-vmx.exe 22116 [ws@4413 threadName="vmx"] Capability Found: vpmc.fixctr.0 = 1
2025-12-14T09:04:59.057Z -INFO vmware-vmx.exe 22116 [ws@4413 threadName="vmx"] Capability Found: vpmc.fixctr.1 = 1
2025-12-14T09:04:59.057Z -INFO vmware-vmx.exe 22116 [ws@4413 threadName="vmx"] Capability Found: vpmc.fixctr.2 = 1
2025-12-14T09:04:59.057Z -INFO vmware-vmx.exe 22116 [ws@4413 threadName="vmx"] FeatureCompat: Requirements:
2025-12-14T09:04:59.057Z -INFO vmware-vmx.exe 22116 [ws@4413 threadName="vmx"] VM Features Required: cpuid.sse3 - Bool:Min:1
2025-12-14T09:04:59.057Z -INFO vmware-vmx.exe 22116 [ws@4413 threadName="vmx"] VM Features Required: cpuid.pclmulqdq - Bool:Min:1
2025-12-14T09:04:59.057Z -INFO vmware-vmx.exe 22116 [ws@4413 threadName="vmx"] VM Features Required: cpuid.ssse3 - Bool:Min:1
2025-12-14T09:04:59.057Z -INFO vmware-vmx.exe 22116 [ws@4413 threadName="vmx"] VM Features Required: cpuid.fma - Bool:Min:1
2025-12-14T09:04:59.057Z -INFO vmware-vmx.exe 22116 [ws@4413 threadName="vmx"] VM Features Required: cpuid.cmpxchg16b - Bool:Min:1
2025-12-14T09:04:59.057Z -INFO vmware-vmx.exe 22116 [ws@4413 threadName="vmx"] VM Features Required: cpuid.pcid - Bool:Min:1
2025-12-14T09:04:59.057Z -INFO vmware-vmx.exe 22116 [ws@4413 threadName="vmx"] VM Features Required: cpuid.sse41 - Bool:Min:1
2025-12-14T09:04:59.057Z -INFO vmware-vmx.exe 22116 [ws@4413 threadName="vmx"] VM Features Required: cpuid.sse42 - Bool:Min:1
2025-12-14T09:04:59.057Z -INFO vmware-vmx.exe 22116 [ws@4413 threadName="vmx"] VM Features Required: cpuid.movbe - Bool:Min:1
2025-12-14T09:04:59.057Z -INFO vmware-vmx.exe 22116 [ws@4413 threadName="vmx"] VM Features Required: cpuid.popcnt - Bool:Min:1
2025-12-14T09:04:59.057Z -INFO vmware-vmx.exe 22116 [ws@4413 threadName="vmx"] VM Features Required: cpuid.aes - Bool:Min:1
2025-12-14T09:04:59.057Z -INFO vmware-vmx.exe 22116 [ws@4413 threadName="vmx"] VM Features Required: cpuid.xsave - Bool:Min:1
2025-12-14T09:04:59.057Z -INFO vmware-vmx.exe 22116 [ws@4413 threadName="vmx"] VM Features Required: cpuid.avx - Bool:Min:1
2025-12-14T09:04:59.057Z -INFO vmware-vmx.exe 22116 [ws@4413 threadName="vmx"] VM Features Required: cpuid.f16c - Bool:Min:1
2025-12-14T09:04:59.057Z -INFO vmware-vmx.exe 22116 [ws@4413 threadName="vmx"] VM Features Required: cpuid.rdrand - Bool:Min:1
2025-12-14T09:04:59.057Z -INFO vmware-vmx.exe 22116 [ws@4413 threadName="vmx"] VM Features Required: cpuid.ss - Bool:Min:1
2025-12-14T09:04:59.058Z -INFO vmware-vmx.exe 22116 [ws@4413 threadName="vmx"] VM Features Required: cpuid.fsgsbase - Bool:Min:1
2025-12-14T09:04:59.058Z -INFO vmware-vmx.exe 22116 [ws@4413 threadName="vmx"] VM Features Required: cpuid.bmi1 - Bool:Min:1
2025-12-14T09:04:59.058Z -INFO vmware-vmx.exe 22116 [ws@4413 threadName="vmx"] VM Features Required: cpuid.avx2 - Bool:Min:1
2025-12-14T09:04:59.058Z -INFO vmware-vmx.exe 22116 [ws@4413 threadName="vmx"] VM Features Required: cpuid.smep - Bool:Min:1
2025-12-14T09:04:59.058Z -INFO vmware-vmx.exe 22116 [ws@4413 threadName="vmx"] VM Features Required: cpuid.bmi2 - Bool:Min:1
2025-12-14T09:04:59.058Z -INFO vmware-vmx.exe 22116 [ws@4413 threadName="vmx"] VM Features Required: cpuid.enfstrg - Bool:Min:1
2025-12-14T09:04:59.058Z -INFO vmware-vmx.exe 22116 [ws@4413 threadName="vmx"] VM Features Required: cpuid.invpcid - Bool:Min:1
2025-12-14T09:04:59.058Z -INFO vmware-vmx.exe 22116 [ws@4413 threadName="vmx"] VM Features Required: cpuid.rdseed - Bool:Min:1
2025-12-14T09:04:59.058Z -INFO vmware-vmx.exe 22116 [ws@4413 threadName="vmx"] VM Features Required: cpuid.adx - Bool:Min:1
2025-12-14T09:04:59.058Z -INFO vmware-vmx.exe 22116 [ws@4413 threadName="vmx"] VM Features Required: cpuid.smap - Bool:Min:1
2025-12-14T09:04:59.058Z -INFO vmware-vmx.exe 22116 [ws@4413 threadName="vmx"] VM Features Required: cpuid.clflushopt - Bool:Min:1
2025-12-14T09:04:59.058Z -INFO vmware-vmx.exe 22116 [ws@4413 threadName="vmx"] VM Features Required: cpuid.mdclear - Bool:Min:1
2025-12-14T09:04:59.058Z -INFO vmware-vmx.exe 22116 [ws@4413 threadName="vmx"] VM Features Required: cpuid.stibp - Bool:Min:1
2025-12-14T09:04:59.058Z -INFO vmware-vmx.exe 22116 [ws@4413 threadName="vmx"] VM Features Required: cpuid.fcmd - Bool:Min:1
2025-12-14T09:04:59.058Z -INFO vmware-vmx.exe 22116 [ws@4413 threadName="vmx"] VM Features Required: cpuid.ssbd - Bool:Min:1
2025-12-14T09:04:59.058Z -INFO vmware-vmx.exe 22116 [ws@4413 threadName="vmx"] VM Features Required: cpuid.xcr0_master_sse - Bool:Min:1
2025-12-14T09:04:59.058Z -INFO vmware-vmx.exe 22116 [ws@4413 threadName="vmx"] VM Features Required: cpuid.xcr0_master_ymm_h - Bool:Min:1
2025-12-14T09:04:59.058Z -INFO vmware-vmx.exe 22116 [ws@4413 threadName="vmx"] VM Features Required: cpuid.xsaveopt - Bool:Min:1
2025-12-14T09:04:59.058Z -INFO vmware-vmx.exe 22116 [ws@4413 threadName="vmx"] VM Features Required: cpuid.xsavec - Bool:Min:1
2025-12-14T09:04:59.058Z -INFO vmware-vmx.exe 22116 [ws@4413 threadName="vmx"] VM Features Required: cpuid.xsaves - Bool:Min:1
2025-12-14T09:04:59.058Z -INFO vmware-vmx.exe 22116 [ws@4413 threadName="vmx"] VM Features Required: cpuid.lahf64 - Bool:Min:1
2025-12-14T09:04:59.058Z -INFO vmware-vmx.exe 22116 [ws@4413 threadName="vmx"] VM Features Required: cpuid.abm - Bool:Min:1
2025-12-14T09:04:59.058Z -INFO vmware-vmx.exe 22116 [ws@4413 threadName="vmx"] VM Features Required: cpuid.3dnprefetch - Bool:Min:1
2025-12-14T09:04:59.058Z -INFO vmware-vmx.exe 22116 [ws@4413 threadName="vmx"] VM Features Required: cpuid.nx - Bool:Min:1
2025-12-14T09:04:59.058Z -INFO vmware-vmx.exe 22116 [ws@4413 threadName="vmx"] VM Features Required: cpuid.pdpe1gb - Bool:Min:1
2025-12-14T09:04:59.058Z -INFO vmware-vmx.exe 22116 [ws@4413 threadName="vmx"] VM Features Required: cpuid.rdtscp - Bool:Min:1
2025-12-14T09:04:59.058Z -INFO vmware-vmx.exe 22116 [ws@4413 threadName="vmx"] VM Features Required: cpuid.lm - Bool:Min:1
2025-12-14T09:04:59.058Z -INFO vmware-vmx.exe 22116 [ws@4413 threadName="vmx"] VM Features Required: cpuid.intel - Bool:Min:1
2025-12-14T09:04:59.058Z -INFO vmware-vmx.exe 22116 [ws@4413 threadName="vmx"] VM Features Required: cpuid.ibrs - Bool:Min:1
2025-12-14T09:04:59.058Z -INFO vmware-vmx.exe 22116 [ws@4413 threadName="vmx"] VM Features Required: cpuid.ibpb - Bool:Min:1
2025-12-14T09:04:59.059Z -INFO vmware-vmx.exe 22116 [ws@4413 threadName="vmx"] TOOLS received request in VMX to set option 'enableDnD' -> '1'
2025-12-14T09:04:59.060Z -INFO vmware-vmx.exe 22116 [ws@4413 threadName="vmx"]
2025-12-14T09:04:59.060Z +INFO vmware-vmx.exe 22116 [ws@4413 threadName="vmx"] OvhdMem: Static (Power On) Overheads
2025-12-14T09:04:59.060Z -INFO vmware-vmx.exe 22116 [ws@4413 threadName="vmx"] reserved | used
2025-12-14T09:04:59.060Z -INFO vmware-vmx.exe 22116 [ws@4413 threadName="vmx"] OvhdMem excluded cur max avg | cur max avg
2025-12-14T09:04:59.060Z -INFO vmware-vmx.exe 22116 [ws@4413 threadName="vmx"] OvhdMem OvhdUser_MainMem : 1572864 1572864 - | 0 0 -
2025-12-14T09:04:59.060Z -INFO vmware-vmx.exe 22116 [ws@4413 threadName="vmx"] OvhdMem OvhdUser_VmxText : 7936 7936 - | 0 0 -
2025-12-14T09:04:59.060Z -INFO vmware-vmx.exe 22116 [ws@4413 threadName="vmx"] OvhdMem OvhdUser_VmxTextLibs : 17408 17408 - | 0 0 -
2025-12-14T09:04:59.060Z -INFO vmware-vmx.exe 22116 [ws@4413 threadName="vmx"] OvhdMem Total excluded : 1598208 1598208 - | - - -
2025-12-14T09:04:59.060Z -INFO vmware-vmx.exe 22116 [ws@4413 threadName="vmx"] OvhdMem Actual maximum : 1598208 | -
2025-12-14T09:04:59.060Z +INFO vmware-vmx.exe 22116 [ws@4413 threadName="vmx"]
2025-12-14T09:04:59.060Z -INFO vmware-vmx.exe 22116 [ws@4413 threadName="vmx"] reserved | used
2025-12-14T09:04:59.060Z -INFO vmware-vmx.exe 22116 [ws@4413 threadName="vmx"] OvhdMem paged cur max avg | cur max avg
2025-12-14T09:04:59.060Z -INFO vmware-vmx.exe 22116 [ws@4413 threadName="vmx"] OvhdMem OvhdUser_STATS_vmm : 4 4 - | 0 0 -
2025-12-14T09:04:59.060Z -INFO vmware-vmx.exe 22116 [ws@4413 threadName="vmx"] OvhdMem OvhdUser_STATS_device : 2 2 - | 0 0 -
2025-12-14T09:04:59.060Z -INFO vmware-vmx.exe 22116 [ws@4413 threadName="vmx"] OvhdMem OvhdUser_SvgaMobFallback : 131072 131072 - | 0 0 -
2025-12-14T09:04:59.060Z -INFO vmware-vmx.exe 22116 [ws@4413 threadName="vmx"] OvhdMem OvhdUser_DiskLibMemUsed : 3075 3075 - | 0 0 -
2025-12-14T09:04:59.060Z -INFO vmware-vmx.exe 22116 [ws@4413 threadName="vmx"] OvhdMem OvhdUser_SvgaSurfaceTable : 2944 2944 - | 385 385 -
2025-12-14T09:04:59.060Z -INFO vmware-vmx.exe 22116 [ws@4413 threadName="vmx"] OvhdMem OvhdUser_SvgaSDirtyCache : 96 96 - | 0 0 -
2025-12-14T09:04:59.060Z -INFO vmware-vmx.exe 22116 [ws@4413 threadName="vmx"] OvhdMem OvhdUser_SvgaShaderTable : 1000 1000 - | 193 193 -
2025-12-14T09:04:59.060Z -INFO vmware-vmx.exe 22116 [ws@4413 threadName="vmx"] OvhdMem OvhdUser_SvgaShaderText : 2048 2048 - | 0 0 -
2025-12-14T09:04:59.060Z -INFO vmware-vmx.exe 22116 [ws@4413 threadName="vmx"] OvhdMem OvhdUser_SvgaContextCache : 1405 1405 - | 0 0 -
2025-12-14T09:04:59.060Z -INFO vmware-vmx.exe 22116 [ws@4413 threadName="vmx"] OvhdMem OvhdUser_SvgaObjTables : 3908 3908 - | 202 202 -
2025-12-14T09:04:59.060Z -INFO vmware-vmx.exe 22116 [ws@4413 threadName="vmx"] OvhdMem OvhdUser_SvgaDXShaderText : 4096 4096 - | 0 0 -
2025-12-14T09:04:59.060Z -INFO vmware-vmx.exe 22116 [ws@4413 threadName="vmx"] OvhdMem OvhdUser_SvgaVAProcessorTable : 1 1 - | 0 0 -
2025-12-14T09:04:59.060Z -INFO vmware-vmx.exe 22116 [ws@4413 threadName="vmx"] OvhdMem OvhdUser_SvgaVADecoderTable : 1 1 - | 0 0 -
2025-12-14T09:04:59.060Z -INFO vmware-vmx.exe 22116 [ws@4413 threadName="vmx"] OvhdMem OvhdUser_SvgaCursor : 10 10 - | 10 10 -
2025-12-14T09:04:59.060Z -INFO vmware-vmx.exe 22116 [ws@4413 threadName="vmx"] OvhdMem OvhdUser_SvgaPPNList : 130 130 - | 0 0 -
2025-12-14T09:04:59.060Z -INFO vmware-vmx.exe 22116 [ws@4413 threadName="vmx"] OvhdMem OvhdUser_VmxGlobals : 10240 10240 - | 0 0 -
2025-12-14T09:04:59.060Z -INFO vmware-vmx.exe 22116 [ws@4413 threadName="vmx"] OvhdMem OvhdUser_VmxGlobalsLibs : 3584 3584 - | 0 0 -
2025-12-14T09:04:59.060Z -INFO vmware-vmx.exe 22116 [ws@4413 threadName="vmx"] OvhdMem OvhdUser_VmxHeap : 10752 10752 - | 0 0 -
2025-12-14T09:04:59.060Z -INFO vmware-vmx.exe 22116 [ws@4413 threadName="vmx"] OvhdMem OvhdUser_VmxMks : 49 49 - | 0 0 -
2025-12-14T09:04:59.060Z -INFO vmware-vmx.exe 22116 [ws@4413 threadName="vmx"] OvhdMem OvhdUser_VmxMksRenderOps : 3494 3494 - | 2781 2781 -
2025-12-14T09:04:59.060Z -INFO vmware-vmx.exe 22116 [ws@4413 threadName="vmx"] OvhdMem OvhdUser_VmxMks3d : 819200 819200 - | 0 0 -
2025-12-14T09:04:59.060Z -INFO vmware-vmx.exe 22116 [ws@4413 threadName="vmx"] OvhdMem OvhdUser_VmxMksLLVM : 12288 12288 - | 0 0 -
2025-12-14T09:04:59.060Z -INFO vmware-vmx.exe 22116 [ws@4413 threadName="vmx"] OvhdMem OvhdUser_VmxMksScreenTemp : 69890 69890 - | 0 0 -
2025-12-14T09:04:59.060Z -INFO vmware-vmx.exe 22116 [ws@4413 threadName="vmx"] OvhdMem OvhdUser_VmxMksVnc : 74936 74936 - | 0 0 -
2025-12-14T09:04:59.060Z -INFO vmware-vmx.exe 22116 [ws@4413 threadName="vmx"] OvhdMem OvhdUser_VmxMksScreen : 131075 131075 - | 0 0 -
2025-12-14T09:04:59.060Z -INFO vmware-vmx.exe 22116 [ws@4413 threadName="vmx"] OvhdMem OvhdUser_VmxMksSVGAVO : 4096 4096 - | 0 0 -
2025-12-14T09:04:59.060Z -INFO vmware-vmx.exe 22116 [ws@4413 threadName="vmx"] OvhdMem OvhdUser_VmxMksSwbCursor : 4096 4096 - | 0 0 -
2025-12-14T09:04:59.060Z -INFO vmware-vmx.exe 22116 [ws@4413 threadName="vmx"] OvhdMem OvhdUser_VmxPhysMemErrPages : 10 10 - | 0 0 -
2025-12-14T09:04:59.060Z -INFO vmware-vmx.exe 22116 [ws@4413 threadName="vmx"] OvhdMem OvhdUser_VmxSLEntryBuf : 128 128 - | 0 0 -
2025-12-14T09:04:59.060Z -INFO vmware-vmx.exe 22116 [ws@4413 threadName="vmx"] OvhdMem OvhdUser_VmxThreads : 36864 36864 - | 0 0 -
2025-12-14T09:04:59.060Z -INFO vmware-vmx.exe 22116 [ws@4413 threadName="vmx"] OvhdMem Total paged : 1330494 1330494 - | 3571 3571 -
2025-12-14T09:04:59.060Z -INFO vmware-vmx.exe 22116 [ws@4413 threadName="vmx"] OvhdMem Actual maximum : 1330494 | 1330494
2025-12-14T09:04:59.060Z +INFO vmware-vmx.exe 22116 [ws@4413 threadName="vmx"]
2025-12-14T09:04:59.060Z -INFO vmware-vmx.exe 22116 [ws@4413 threadName="vmx"] reserved | used
2025-12-14T09:04:59.060Z -INFO vmware-vmx.exe 22116 [ws@4413 threadName="vmx"] OvhdMem nonpaged cur max avg | cur max avg
2025-12-14T09:04:59.060Z -INFO vmware-vmx.exe 22116 [ws@4413 threadName="vmx"] OvhdMem OvhdUser_SharedArea : 152 152 - | 135 135 -
2025-12-14T09:04:59.060Z -INFO vmware-vmx.exe 22116 [ws@4413 threadName="vmx"] OvhdMem OvhdUser_BusMemTraceBitmap : 53 53 - | 0 0 -
2025-12-14T09:04:59.060Z -INFO vmware-vmx.exe 22116 [ws@4413 threadName="vmx"] OvhdMem OvhdUser_PFrame : 3261 4290 - | 3261 3261 -
2025-12-14T09:04:59.060Z -INFO vmware-vmx.exe 22116 [ws@4413 threadName="vmx"] OvhdMem OvhdUser_VIDE_KSEG : 16 16 - | 16 16 -
2025-12-14T09:04:59.060Z -INFO vmware-vmx.exe 22116 [ws@4413 threadName="vmx"] OvhdMem OvhdUser_VGA : 64 64 - | 64 64 -
2025-12-14T09:04:59.060Z -INFO vmware-vmx.exe 22116 [ws@4413 threadName="vmx"] OvhdMem OvhdUser_BalloonMPN : 1 1 - | 1 1 -
2025-12-14T09:04:59.060Z -INFO vmware-vmx.exe 22116 [ws@4413 threadName="vmx"] OvhdMem OvhdUser_P2MUpdateBuffer : 3 3 - | 0 0 -
2025-12-14T09:04:59.060Z -INFO vmware-vmx.exe 22116 [ws@4413 threadName="vmx"] OvhdMem OvhdUser_ServicesMPN : 3 3 - | 2 2 -
2025-12-14T09:04:59.060Z -INFO vmware-vmx.exe 22116 [ws@4413 threadName="vmx"] OvhdMem OvhdUser_LocalApic : 2 2 - | 2 2 -
2025-12-14T09:04:59.060Z -INFO vmware-vmx.exe 22116 [ws@4413 threadName="vmx"] OvhdMem OvhdUser_VBIOS : 8 8 - | 0 0 -
2025-12-14T09:04:59.060Z -INFO vmware-vmx.exe 22116 [ws@4413 threadName="vmx"] OvhdMem OvhdUser_LSSSOS : 4 4 - | 0 0 -
2025-12-14T09:04:59.060Z -INFO vmware-vmx.exe 22116 [ws@4413 threadName="vmx"] OvhdMem OvhdUser_LSIRings : 4 4 - | 0 0 -
2025-12-14T09:04:59.060Z -INFO vmware-vmx.exe 22116 [ws@4413 threadName="vmx"] OvhdMem OvhdUser_SAS1068BIOS : 4 4 - | 0 0 -
2025-12-14T09:04:59.060Z -INFO vmware-vmx.exe 22116 [ws@4413 threadName="vmx"] OvhdMem OvhdUser_SBIOS : 16 16 - | 0 0 -
2025-12-14T09:04:59.060Z -INFO vmware-vmx.exe 22116 [ws@4413 threadName="vmx"] OvhdMem OvhdUser_AHCSSOS : 16 16 - | 0 0 -
2025-12-14T09:04:59.060Z -INFO vmware-vmx.exe 22116 [ws@4413 threadName="vmx"] OvhdMem OvhdUser_AHCIREGS : 1 1 - | 1 1 -
2025-12-14T09:04:59.060Z -INFO vmware-vmx.exe 22116 [ws@4413 threadName="vmx"] OvhdMem OvhdUser_FlashRam : 128 128 - | 0 0 -
2025-12-14T09:04:59.060Z -INFO vmware-vmx.exe 22116 [ws@4413 threadName="vmx"] OvhdMem OvhdUser_SVGAFB : 1024 1024 - | 0 0 -
2025-12-14T09:04:59.060Z -INFO vmware-vmx.exe 22116 [ws@4413 threadName="vmx"] OvhdMem OvhdUser_SVGAMEM : 64 512 - | 0 0 -
2025-12-14T09:04:59.060Z -INFO vmware-vmx.exe 22116 [ws@4413 threadName="vmx"] OvhdMem OvhdUser_HDAudioReg : 3 3 - | 0 0 -
2025-12-14T09:04:59.060Z -INFO vmware-vmx.exe 22116 [ws@4413 threadName="vmx"] OvhdMem OvhdUser_EHCIRegister : 1 1 - | 1 1 -
2025-12-14T09:04:59.060Z -INFO vmware-vmx.exe 22116 [ws@4413 threadName="vmx"] OvhdMem OvhdUser_XhciRegister : 1 1 - | 0 0 -
2025-12-14T09:04:59.060Z -INFO vmware-vmx.exe 22116 [ws@4413 threadName="vmx"] OvhdMem OvhdUser_HyperV : 2 2 - | 0 0 -
2025-12-14T09:04:59.060Z -INFO vmware-vmx.exe 22116 [ws@4413 threadName="vmx"] OvhdMem OvhdUser_ExtCfg : 4 4 - | 0 0 -
2025-12-14T09:04:59.060Z -INFO vmware-vmx.exe 22116 [ws@4413 threadName="vmx"] OvhdMem OvhdUser_vhvCachedVMCS : 2 2 - | 0 0 -
2025-12-14T09:04:59.060Z -INFO vmware-vmx.exe 22116 [ws@4413 threadName="vmx"] OvhdMem OvhdUser_vhvNestedAPIC : 2 2 - | 0 0 -
2025-12-14T09:04:59.060Z -INFO vmware-vmx.exe 22116 [ws@4413 threadName="vmx"] OvhdMem OvhdUser_LBR : 2 2 - | 0 0 -
2025-12-14T09:04:59.060Z -INFO vmware-vmx.exe 22116 [ws@4413 threadName="vmx"] OvhdMem OvhdUser_MonWired : 53 53 - | 53 53 -
2025-12-14T09:04:59.060Z -INFO vmware-vmx.exe 22116 [ws@4413 threadName="vmx"] OvhdMem OvhdUser_MonNuma : 299 299 - | 0 0 -
2025-12-14T09:04:59.060Z -INFO vmware-vmx.exe 22116 [ws@4413 threadName="vmx"] OvhdMem OvhdUser_NVDC : 1 1 - | 0 0 -
2025-12-14T09:04:59.060Z -INFO vmware-vmx.exe 22116 [ws@4413 threadName="vmx"] OvhdMem OvhdUser_PCIeMMIOArea : 70 70 - | 36 36 -
2025-12-14T09:04:59.060Z -INFO vmware-vmx.exe 22116 [ws@4413 threadName="vmx"] OvhdMem Total nonpaged : 5264 6741 - | 3572 3572 -
2025-12-14T09:04:59.060Z -INFO vmware-vmx.exe 22116 [ws@4413 threadName="vmx"] OvhdMem Actual maximum : 5264 | 6741
2025-12-14T09:04:59.060Z +INFO vmware-vmx.exe 22116 [ws@4413 threadName="vmx"]
2025-12-14T09:04:59.060Z -INFO vmware-vmx.exe 22116 [ws@4413 threadName="vmx"] reserved | used
2025-12-14T09:04:59.061Z -INFO vmware-vmx.exe 22116 [ws@4413 threadName="vmx"] OvhdMem anonymous cur max avg | cur max avg
2025-12-14T09:04:59.061Z -INFO vmware-vmx.exe 22116 [ws@4413 threadName="vmx"] OvhdMem OvhdMon_Alloc : 196 196 - | 0 0 -
2025-12-14T09:04:59.061Z -INFO vmware-vmx.exe 22116 [ws@4413 threadName="vmx"] OvhdMem OvhdMon_BusMemFrame : 1602 1659 - | 0 0 -
2025-12-14T09:04:59.061Z -INFO vmware-vmx.exe 22116 [ws@4413 threadName="vmx"] OvhdMem OvhdMon_BusMem2MInfo : 24 24 - | 0 0 -
2025-12-14T09:04:59.061Z -INFO vmware-vmx.exe 22116 [ws@4413 threadName="vmx"] OvhdMem OvhdMon_BusMem1GInfo : 1 1 - | 0 0 -
2025-12-14T09:04:59.061Z -INFO vmware-vmx.exe 22116 [ws@4413 threadName="vmx"] OvhdMem OvhdMon_BusMemZapListMPN : 1 1 - | 0 0 -
2025-12-14T09:04:59.061Z -INFO vmware-vmx.exe 22116 [ws@4413 threadName="vmx"] OvhdMem OvhdMon_BusMemPreval : 8 8 - | 0 0 -
2025-12-14T09:04:59.061Z -INFO vmware-vmx.exe 22116 [ws@4413 threadName="vmx"] OvhdMem OvhdMon_MonAS : 2 2 - | 0 0 -
2025-12-14T09:04:59.061Z -INFO vmware-vmx.exe 22116 [ws@4413 threadName="vmx"] OvhdMem OvhdMon_GuestMem : 80 80 - | 0 0 -
2025-12-14T09:04:59.061Z -INFO vmware-vmx.exe 22116 [ws@4413 threadName="vmx"] OvhdMem OvhdMon_TC : 1026 1026 - | 0 0 -
2025-12-14T09:04:59.061Z -INFO vmware-vmx.exe 22116 [ws@4413 threadName="vmx"] OvhdMem OvhdMon_BusMemMonAS : 7 7 - | 0 0 -
2025-12-14T09:04:59.061Z -INFO vmware-vmx.exe 22116 [ws@4413 threadName="vmx"] OvhdMem OvhdMon_PlatformMonAS : 11 11 - | 0 0 -
2025-12-14T09:04:59.061Z -INFO vmware-vmx.exe 22116 [ws@4413 threadName="vmx"] OvhdMem OvhdMon_HVNuma : 4 4 - | 0 0 -
2025-12-14T09:04:59.061Z -INFO vmware-vmx.exe 22116 [ws@4413 threadName="vmx"] OvhdMem OvhdMon_HV : 2 2 - | 0 0 -
2025-12-14T09:04:59.061Z -INFO vmware-vmx.exe 22116 [ws@4413 threadName="vmx"] OvhdMem OvhdMon_HVMSRBitmap : 1 1 - | 0 0 -
2025-12-14T09:04:59.061Z -INFO vmware-vmx.exe 22116 [ws@4413 threadName="vmx"] OvhdMem OvhdMon_VHVGuestMSRBitmap : 2 2 - | 0 0 -
2025-12-14T09:04:59.061Z -INFO vmware-vmx.exe 22116 [ws@4413 threadName="vmx"] OvhdMem OvhdMon_Numa : 30 30 - | 0 0 -
2025-12-14T09:04:59.061Z -INFO vmware-vmx.exe 22116 [ws@4413 threadName="vmx"] OvhdMem OvhdMon_NumaTextRodata : 201 201 - | 0 0 -
2025-12-14T09:04:59.061Z -INFO vmware-vmx.exe 22116 [ws@4413 threadName="vmx"] OvhdMem OvhdMon_NumaDataBss : 98 98 - | 0 0 -
2025-12-14T09:04:59.061Z -INFO vmware-vmx.exe 22116 [ws@4413 threadName="vmx"] OvhdMem OvhdMon_BaseWired : 58 58 - | 0 0 -
2025-12-14T09:04:59.061Z -INFO vmware-vmx.exe 22116 [ws@4413 threadName="vmx"] OvhdMem OvhdMon_Bootstrap : 2303 2303 - | 0 0 -
2025-12-14T09:04:59.061Z -INFO vmware-vmx.exe 22116 [ws@4413 threadName="vmx"] OvhdMem OvhdMon_GPhysTraced : 668 668 - | 0 0 -
2025-12-14T09:04:59.061Z -INFO vmware-vmx.exe 22116 [ws@4413 threadName="vmx"] OvhdMem OvhdMon_GPhysHWMMU : 3338 3338 - | 0 0 -
2025-12-14T09:04:59.061Z -INFO vmware-vmx.exe 22116 [ws@4413 threadName="vmx"] OvhdMem OvhdMon_GPhysNoTrace : 266 266 - | 0 0 -
2025-12-14T09:04:59.061Z -INFO vmware-vmx.exe 22116 [ws@4413 threadName="vmx"] OvhdMem OvhdMon_PhysMemGart : 104 104 - | 0 0 -
2025-12-14T09:04:59.061Z -INFO vmware-vmx.exe 22116 [ws@4413 threadName="vmx"] OvhdMem OvhdMon_PhysMemErr : 7 7 - | 0 0 -
2025-12-14T09:04:59.061Z -INFO vmware-vmx.exe 22116 [ws@4413 threadName="vmx"] OvhdMem OvhdMon_VProbe : 1 1 - | 0 0 -
2025-12-14T09:04:59.061Z -INFO vmware-vmx.exe 22116 [ws@4413 threadName="vmx"] OvhdMem Total anonymous : 10041 10098 - | 0 0 -
2025-12-14T09:04:59.061Z -INFO vmware-vmx.exe 22116 [ws@4413 threadName="vmx"] OvhdMem Actual maximum : 10041 | 10098
2025-12-14T09:04:59.061Z +INFO vmware-vmx.exe 22116 [ws@4413 threadName="vmx"]
2025-12-14T09:04:59.061Z -INFO vmware-vmx.exe 22116 [ws@4413 threadName="vmx"] VMMEM: Precise Reservation: 5257MB (MainMem=6144MB)
2025-12-14T09:04:59.061Z -INFO vmware-vmx.exe 22116 [ws@4413 threadName="vmx"] Vix: [mainDispatch.c:1060]: VMAutomation_PowerOn. Powering on.
2025-12-14T09:04:59.062Z -NOTICE vmware-vmx.exe 22116 [ws@4413 threadName="vmx"] PowerOnTiming: ALL took 1846349 us
2025-12-14T09:04:59.062Z -INFO vmware-vmx.exe 22116 [ws@4413 threadName="vmx"] VMX_PowerOn: ModuleTable_PowerOn = 1
2025-12-14T09:04:59.062Z -NOTICE vmware-vmx.exe 22116 [ws@4413 threadName="vmx"] ConfigDB: Setting cleanShutdown = "FALSE"
2025-12-14T09:04:59.062Z -NOTICE vmware-vmx.exe 22116 [ws@4413 threadName="vmx"] ConfigDB: Setting softPowerOff = "FALSE"
2025-12-14T09:04:59.062Z -INFO vmware-vmx.exe 22116 [ws@4413 threadName="vcpu-0"] VTHREAD 876 "vcpu-0"
2025-12-14T09:04:59.062Z -INFO vmware-vmx.exe 22116 [ws@4413 threadName="vmx"] ToolsISO: Refreshing imageName for 'windows9-64' (refreshCount=1, lastCount=1).
2025-12-14T09:04:59.064Z -INFO vmware-vmx.exe 22116 [ws@4413 threadName="vmx"] ToolsISO: open of C:\Program Files (x86)\VMware\VMware Workstation\isoimages_manifest.txt.sig failed: Could not find the file
2025-12-14T09:04:59.064Z -INFO vmware-vmx.exe 22116 [ws@4413 threadName="vmx"] ToolsISO: Unable to read signature file 'C:\Program Files (x86)\VMware\VMware Workstation\isoimages_manifest.txt.sig', ignoring.
2025-12-14T09:04:59.064Z -INFO vmware-vmx.exe 22116 [ws@4413 threadName="vmx"] ToolsISO: Updated cached value for imageName to 'windows.iso'.
2025-12-14T09:04:59.064Z -INFO vmware-vmx.exe 22116 [ws@4413 threadName="vmx"] ToolsISO: Selected Tools ISO 'windows.iso' for 'windows9-64' guest.
2025-12-14T09:04:59.064Z -INFO vmware-vmx.exe 22116 [ws@4413 threadName="vmx"] TOOLS updated cached value for isoImageExists to 1.
2025-12-14T09:04:59.064Z -INFO vmware-vmx.exe 22116 [ws@4413 threadName="vmx"] VMXVmdb_SetToolsVersionStatus: status value set to 'ok', 'current', install possible
2025-12-14T09:04:59.067Z -INFO vmware-vmx.exe 22116 [ws@4413 threadName="vcpu-0"] MonTimer APIC:0/0 vec: 0
2025-12-14T09:04:59.067Z -INFO vmware-vmx.exe 22116 [ws@4413 threadName="vcpu-0"] APIC: version = 0x15, max LVT = 6, LDR = 0x40, DFR = 0xffffffff
2025-12-14T09:04:59.067Z -INFO vmware-vmx.exe 22116 [ws@4413 threadName="vcpu-0"] Active HV capabilities
2025-12-14T09:04:59.067Z -INFO vmware-vmx.exe 22116 [ws@4413 threadName="vcpu-0"] Full decode
2025-12-14T09:04:59.067Z -INFO vmware-vmx.exe 22116 [ws@4413 threadName="vcpu-0"] Nested paging A/D bits
2025-12-14T09:04:59.067Z -INFO vmware-vmx.exe 22116 [ws@4413 threadName="vcpu-0"] Real-address mode
2025-12-14T09:04:59.067Z -INFO vmware-vmx.exe 22116 [ws@4413 threadName="vcpu-0"] Skip debug state
2025-12-14T09:04:59.067Z -INFO vmware-vmx.exe 22116 [ws@4413 threadName="vcpu-0"] X2APIC virtualization
2025-12-14T09:04:59.067Z -INFO vmware-vmx.exe 22116 [ws@4413 threadName="vcpu-0"] BNDCFGS/MPX
2025-12-14T09:04:59.067Z -INFO vmware-vmx.exe 22116 [ws@4413 threadName="vcpu-0"] Page-modification logging
2025-12-14T09:04:59.067Z -INFO vmware-vmx.exe 22116 [ws@4413 threadName="vcpu-0"] ENCLS exiting
2025-12-14T09:04:59.067Z -INFO vmware-vmx.exe 22116 [ws@4413 threadName="vcpu-0"] PAUSE-loop exiting
2025-12-14T09:04:59.067Z -INFO vmware-vmx.exe 22116 [ws@4413 threadName="vcpu-0"] Advanced exit information for EPT violations
2025-12-14T09:04:59.067Z -INFO vmware-vmx.exe 22116 [ws@4413 threadName="vcpu-0"] Mode-based execute control for nested paging
2025-12-14T09:04:59.067Z -INFO vmware-vmx.exe 22116 [ws@4413 threadName="vcpu-0"] EPT-violation virtualization exception
2025-12-14T09:04:59.067Z -INFO vmware-vmx.exe 22116 [ws@4413 threadName="vcpu-0"] Event injection with instruction length zero
2025-12-14T09:04:59.072Z -INFO vmware-vmx.exe 22116 [ws@4413 threadName="vcpu-0"] CPU reset: hard (mode Emulation)
2025-12-14T09:04:59.072Z -INFO vmware-vmx.exe 22116 [ws@4413 threadName="vcpu-1"] VTHREAD 17296 "vcpu-1"
2025-12-14T09:04:59.072Z -INFO vmware-vmx.exe 22116 [ws@4413 threadName="vcpu-1"] MonTimer APIC:0/0 vec: 0
2025-12-14T09:04:59.072Z -INFO vmware-vmx.exe 22116 [ws@4413 threadName="vcpu-1"] APIC: version = 0x15, max LVT = 6, LDR = 0x10, DFR = 0xffffffff
2025-12-14T09:04:59.073Z -INFO vmware-vmx.exe 22116 [ws@4413 threadName="vcpu-1"] CPU reset: hard (mode Emulation)
2025-12-14T09:04:59.073Z -INFO vmware-vmx.exe 22116 [ws@4413 threadName="svga"] MKSThread: SVGA thread is entering the main loop
2025-12-14T09:04:59.073Z -INFO vmware-vmx.exe 22116 [ws@4413 threadName="vcpu-0"] GuestRpc: Successfully created RPCI listening socket.
2025-12-14T09:04:59.073Z -INFO vmware-vmx.exe 22116 [ws@4413 threadName="vcpu-0"] GuestRpc: Using vsocket for TCLO messaging is disabled.
2025-12-14T09:04:59.073Z -NOTICE vmware-vmx.exe 22116 [ws@4413 threadName="vcpu-0"] ConfigDB: Unsetting all entries with prefix "usb_xhci:4."
2025-12-14T09:04:59.087Z -INFO vmware-vmx.exe 22116 [ws@4413 threadName="vcpu-0"] USB: DevID(2000000400000000): Disconnecting device.
2025-12-14T09:04:59.087Z -INFO vmware-vmx.exe 22116 [ws@4413 threadName="vcpu-0"] USB: DevID(200000050e0f0003): Connecting device desc:name:VMware\ Virtual\ USB\ Mouse vid:0e0f pid:0003 speed:full family:hid deviceType:virtual-hid info:0000005 version:5.
2025-12-14T09:04:59.087Z -NOTICE vmware-vmx.exe 22116 [ws@4413 threadName="vcpu-0"] ConfigDB: Setting usb_xhci:4.present = "TRUE"
2025-12-14T09:04:59.087Z -NOTICE vmware-vmx.exe 22116 [ws@4413 threadName="vcpu-0"] ConfigDB: Setting usb_xhci:4.deviceType = "hid"
2025-12-14T09:04:59.087Z -NOTICE vmware-vmx.exe 22116 [ws@4413 threadName="vcpu-0"] ConfigDB: Setting usb_xhci:4.port = "4"
2025-12-14T09:04:59.087Z -NOTICE vmware-vmx.exe 22116 [ws@4413 threadName="vcpu-0"] ConfigDB: Setting usb_xhci:4.parent = "-1"
2025-12-14T09:04:59.097Z -INFO vmware-vmx.exe 22116 [ws@4413 threadName="vcpu-0"] memoryHotplug: Node 0: Present: 6143 MB (100 %) Size:98303 MB (100 %)
2025-12-14T09:04:59.097Z -INFO vmware-vmx.exe 22116 [ws@4413 threadName="vcpu-0"] PIIX4: PM Resuming from suspend type 0x0, chipset.onlineStandby 0
2025-12-14T09:04:59.097Z -INFO vmware-vmx.exe 22116 [ws@4413 threadName="vcpu-0"] SOUNDLIB: Creating the Wave sound backend.
2025-12-14T09:04:59.097Z -INFO vmware-vmx.exe 22116 [ws@4413 threadName="vcpu-0"] HDAudio: HDAudioConnectDisconnect: primary backend: wave, fallback backend: dummy.
2025-12-14T09:04:59.098Z -INFO vmware-vmx.exe 22116 [ws@4413 threadName="vcpu-0"] VNET: 'ethernet0' enable link state propagation, lsp.state = 5
2025-12-14T09:04:59.098Z -INFO vmware-vmx.exe 22116 [ws@4413 threadName="vcpu-0"] VNET: MACVNetConnectToNetwork 'ethernet0' lsp.state = 4
2025-12-14T09:04:59.098Z -INFO vmware-vmx.exe 22116 [ws@4413 threadName="vcpu-0"] VNET: MACVNetConnectToNetwork 'Ethernet0' notify available.
2025-12-14T09:04:59.099Z -INFO vmware-vmx.exe 22116 [ws@4413 threadName="vcpu-0"] HGFSPublish: publishing 1 shares
2025-12-14T09:04:59.101Z -INFO vmware-vmx.exe 22116 [ws@4413 threadName="vcpu-0"] Win32U_GetFileAttributes: GetFileAttributesExW("D:\VM\mb\mb.vmpl", ...) failed, error: 2
2025-12-14T09:04:59.101Z -INFO vmware-vmx.exe 22116 [ws@4413 threadName="vcpu-0"] PolicyVMXFindPolicyKey: policy file does not exist.
2025-12-14T09:04:59.104Z -NOTICE vmware-vmx.exe 22116 [ws@4413 threadName="vcpu-0"] Metrics lastUpdate (s): 5610
2025-12-14T09:04:59.104Z -INFO vmware-vmx.exe 22116 [ws@4413 threadName="vcpu-0"] Vix: [mainDispatch.c:4172]: VMAutomation_ReportPowerOpFinished: statevar=0, newAppState=1872, success=1 additionalError=0
2025-12-14T09:04:59.104Z -INFO vmware-vmx.exe 22116 [ws@4413 threadName="vcpu-0"] Vix: [mainDispatch.c:4089]: VMAutomationReportPowerStateChange: Reporting power state change (opcode=0, err=0).
2025-12-14T09:04:59.104Z -INFO vmware-vmx.exe 22116 [ws@4413 threadName="vcpu-0"] Vix: [mainDispatch.c:4089]: VMAutomationReportPowerStateChange: Reporting power state change (opcode=2, err=0).
2025-12-14T09:04:59.104Z -INFO vmware-vmx.exe 22116 [ws@4413 threadName="vcpu-0"] Transitioned vmx/execState/val to poweredOn
2025-12-14T09:04:59.104Z -INFO vmware-vmx.exe 22116 [ws@4413 threadName="vcpu-0"] Tools: Adding Tools inactivity timer.
2025-12-14T09:04:59.104Z -INFO vmware-vmx.exe 22116 [ws@4413 threadName="vmx"] USB: New set of 2 USB devices.
2025-12-14T09:04:59.104Z -INFO vmware-vmx.exe 22116 [ws@4413 threadName="vcpu-0"] Intel VT: FlexPriority disabled, VPID enabled.
2025-12-14T09:04:59.104Z -INFO vmware-vmx.exe 22116 [ws@4413 threadName="vmx"] USB: Found device [name:Logitech\ Mono\ H650e vid:046d pid:0a47 path:1/0/9 speed:full family:audio,hid instanceId:USB\\VID_046D&PID_0A47\\00000000 serialnum:00000000 arbRuntimeKey:3 version:5]
2025-12-14T09:04:59.104Z -INFO vmware-vmx.exe 22116 [ws@4413 threadName="vmx"] USB: Found device [name:Yubico.com\ YubiKey\ OTP vid:1050 pid:0401 path:1/0/11 speed:full family:hid,hid-bootable instanceId:USB\\VID_1050&PID_0401\\5&1C5CE6EE&0&12 arbRuntimeKey:4 quirks:allow version:5]
2025-12-14T09:04:59.109Z -INFO vmware-vmx.exe 22116 [ws@4413 threadName="vmx"] VNET: MACVNetLinkStateEventHandler: event, up:1, adapter:0
2025-12-14T09:04:59.109Z -INFO vmware-vmx.exe 22116 [ws@4413 threadName="vmx"] VNET: MACVNetLinkStateEventHandler: 'ethernet0' state from 4 to 6.
2025-12-14T09:04:59.131Z -INFO vmware-vmx.exe 22116 [ws@4413 threadName="mks"] MKSControlMgr: Control socket connected
2025-12-14T09:04:59.131Z -INFO vmware-vmx.exe 22116 [ws@4413 threadName="mks"] MKSControl: Connect
2025-12-14T09:04:59.131Z -INFO vmware-vmx.exe 22116 [ws@4413 threadName="mks"] SWBWindow: Number of MKSWindows changed: 1 rendering MKSWindow(s) of total 1.
2025-12-14T09:04:59.131Z -INFO vmware-vmx.exe 22116 [ws@4413 threadName="mks"] SWBWindow: Window 0 Defined CREATED: src screenId=-1, src xywh(0, 0, 3838, 1997) dest xywh(0, 0, 3838, 1997) pixelScale=1, flags=0x HAS_HOST_ORIGIN ALLOW_MKS_GRAB IS_RENDERING
2025-12-14T09:04:59.131Z -INFO vmware-vmx.exe 22116 [ws@4413 threadName="mks"] MKS-HWinMux: Backend Switch Queued
2025-12-14T09:04:59.131Z -INFO vmware-vmx.exe 22116 [ws@4413 threadName="mks"] SWBWindow: Number of MKSWindows changed: 1 rendering MKSWindow(s) of total 2.
2025-12-14T09:04:59.131Z -INFO vmware-vmx.exe 22116 [ws@4413 threadName="mks"] SWBWindow: Window 1 Defined CREATED: src screenId=-1, src xywh(0, 0, 3838, 1997) dest xywh(0, 0, 3838, 1997) pixelScale=1, flags=0x LIMIT_REFRESH_RATE
2025-12-14T09:04:59.131Z -INFO vmware-vmx.exe 22116 [ws@4413 threadName="mks"] MKS-HWinMux: Backend Switch Queued
2025-12-14T09:04:59.147Z -INFO vmware-vmx.exe 22116 [ws@4413 threadName="mks"] DX12Module: Available adapters:
2025-12-14T09:04:59.147Z -INFO vmware-vmx.exe 22116 [ws@4413 threadName="mks"] DX12Module: NVIDIA GeForce GT 1030
2025-12-14T09:04:59.147Z -INFO vmware-vmx.exe 22116 [ws@4413 threadName="mks"] DX12Module: VendorId = 0x10de, DeviceId = 0x1d01, SubSysId = 2247364675, Revision = 161, AdapterLuid = 0x000000000000dafa, Flags = 0x2c
2025-12-14T09:04:59.147Z -INFO vmware-vmx.exe 22116 [ws@4413 threadName="mks"] DX12Module: DedicatedVideoMemory = 2062741504, DedicatedSystemMemory = 0, SharedSystemMemory = 17022842880
2025-12-14T09:04:59.284Z -INFO vmware-vmx.exe 22116 [ws@4413 threadName="mks"] DX12Module: Intel(R) UHD Graphics 630
2025-12-14T09:04:59.284Z -INFO vmware-vmx.exe 22116 [ws@4413 threadName="mks"] DX12Module: VendorId = 0x8086, DeviceId = 0x3e92, SubSysId = 2212499516, Revision = 0, AdapterLuid = 0x000000000000eb5a, Flags = 0x2c
2025-12-14T09:04:59.284Z -INFO vmware-vmx.exe 22116 [ws@4413 threadName="mks"] DX12Module: DedicatedVideoMemory = 134217728, DedicatedSystemMemory = 0, SharedSystemMemory = 17022842880
2025-12-14T09:04:59.295Z -INFO vmware-vmx.exe 22116 [ws@4413 threadName="vcpu-0"] SVGA: Registering MemSpace at 0xe8000000(0x0) and 0xfe000000(0x0)
2025-12-14T09:04:59.295Z -INFO vmware-vmx.exe 22116 [ws@4413 threadName="vcpu-0"] SVGA: FIFO is already mapped
2025-12-14T09:04:59.299Z -INFO vmware-vmx.exe 22116 [ws@4413 threadName="mks"] DX12Module: Microsoft Basic Render Driver
2025-12-14T09:04:59.299Z -INFO vmware-vmx.exe 22116 [ws@4413 threadName="mks"] DX12Module: VendorId = 0x1414, DeviceId = 0x8c, SubSysId = 0, Revision = 0, AdapterLuid = 0x000000000000eb02, Flags = 0x2e
2025-12-14T09:04:59.299Z -INFO vmware-vmx.exe 22116 [ws@4413 threadName="mks"] DX12Module: DedicatedVideoMemory = 0, DedicatedSystemMemory = 0, SharedSystemMemory = 17022842880
2025-12-14T09:04:59.299Z -INFO vmware-vmx.exe 22116 [ws@4413 threadName="vcpu-0"] SVGA: Unregistering MemSpace at 0xe8000000(0xe8000000) and 0xfe000000(0xfe000000)
2025-12-14T09:04:59.300Z -INFO vmware-vmx.exe 22116 [ws@4413 threadName="vcpu-0"] SVGA: FIFO is already mapped
2025-12-14T09:04:59.301Z -INFO vmware-vmx.exe 22116 [ws@4413 threadName="mks"] DX12Module: Trying to create adapter with luid = 0x000000000000dafa
2025-12-14T09:04:59.408Z -INFO vmware-vmx.exe 22116 [ws@4413 threadName="mks"] DX12Module: Selected adapter:
2025-12-14T09:04:59.408Z -INFO vmware-vmx.exe 22116 [ws@4413 threadName="mks"] DX12Module: NVIDIA GeForce GT 1030
2025-12-14T09:04:59.408Z -INFO vmware-vmx.exe 22116 [ws@4413 threadName="mks"] DX12Module: VendorId = 0x10de, DeviceId = 0x1d01, SubSysId = 2247364675, Revision = 161, AdapterLuid = 0x000000000000dafa, Flags = 0x2c
2025-12-14T09:04:59.408Z -INFO vmware-vmx.exe 22116 [ws@4413 threadName="mks"] DX12Module: DedicatedVideoMemory = 2062741504, DedicatedSystemMemory = 0, SharedSystemMemory = 17022842880
2025-12-14T09:04:59.408Z -INFO vmware-vmx.exe 22116 [ws@4413 threadName="mks"] DX12Module: GPU chip: Pascal (Pascal)
2025-12-14T09:04:59.451Z -INFO vmware-vmx.exe 22116 [ws@4413 threadName="vcpu-0"] SVGA: Registering MemSpace at 0xe8000000(0xe8000000) and 0xfe000000(0xfe000000)
2025-12-14T09:04:59.451Z -INFO vmware-vmx.exe 22116 [ws@4413 threadName="vcpu-0"] SVGA: FIFO is already mapped
2025-12-14T09:04:59.456Z -INFO vmware-vmx.exe 22116 [ws@4413 threadName="vcpu-0"] SVGA: Unregistering MemSpace at 0xe8000000(0xe8000000) and 0xfe000000(0xfe000000)
2025-12-14T09:04:59.456Z -INFO vmware-vmx.exe 22116 [ws@4413 threadName="vcpu-0"] SVGA: FIFO is already mapped
2025-12-14T09:04:59.456Z -INFO vmware-vmx.exe 22116 [ws@4413 threadName="vcpu-0"] SVGA: Registering IOSpace at 0x1070
2025-12-14T09:04:59.456Z -INFO vmware-vmx.exe 22116 [ws@4413 threadName="vcpu-0"] SVGA: Registering MemSpace at 0xe8000000(0xe8000000) and 0xfe000000(0xfe000000)
2025-12-14T09:04:59.456Z -INFO vmware-vmx.exe 22116 [ws@4413 threadName="vcpu-0"] SVGA: FIFO is already mapped
2025-12-14T09:04:59.469Z -INFO vmware-vmx.exe 22116 [ws@4413 threadName="vcpu-1"] CPU reset: soft (mode Emulation)
2025-12-14T09:04:59.480Z -INFO vmware-vmx.exe 22116 [ws@4413 threadName="vcpu-0"] SVGA: FIFO is already mapped
2025-12-14T09:04:59.563Z -INFO vmware-vmx.exe 22116 [ws@4413 threadName="mks"] DX12Module: D3D12_FEATURE_D3D12_OPTIONS:
2025-12-14T09:04:59.563Z -INFO vmware-vmx.exe 22116 [ws@4413 threadName="mks"] DX12Module: DoublePrecisionFloatShaderOps = true
2025-12-14T09:04:59.563Z -INFO vmware-vmx.exe 22116 [ws@4413 threadName="mks"] DX12Module: OutputMergerLogicOp = true
2025-12-14T09:04:59.563Z -INFO vmware-vmx.exe 22116 [ws@4413 threadName="mks"] DX12Module: MinPrecisionSupport = D3D12_SHADER_MIN_PRECISION_SUPPORT_NONE
2025-12-14T09:04:59.563Z -INFO vmware-vmx.exe 22116 [ws@4413 threadName="mks"] DX12Module: TiledResourcesTier = D3D12_TILED_RESOURCES_TIER_4
2025-12-14T09:04:59.563Z -INFO vmware-vmx.exe 22116 [ws@4413 threadName="mks"] DX12Module: ResourceBindingTier = D3D12_RESOURCE_BINDING_TIER_3
2025-12-14T09:04:59.563Z -INFO vmware-vmx.exe 22116 [ws@4413 threadName="mks"] DX12Module: PSSpecifiedStencilRefSupported = false
2025-12-14T09:04:59.563Z -INFO vmware-vmx.exe 22116 [ws@4413 threadName="mks"] DX12Module: TypedUAVLoadAdditionalFormats = true
2025-12-14T09:04:59.563Z -INFO vmware-vmx.exe 22116 [ws@4413 threadName="mks"] DX12Module: ROVsSupported = true
2025-12-14T09:04:59.563Z -INFO vmware-vmx.exe 22116 [ws@4413 threadName="mks"] DX12Module: ConservativeRasterizationTier = D3D12_CONSERVATIVE_RASTERIZATION_TIER_2
2025-12-14T09:04:59.563Z -INFO vmware-vmx.exe 22116 [ws@4413 threadName="mks"] DX12Module: MaxGPUVirtualAddressBitsPerResource = 40
2025-12-14T09:04:59.563Z -INFO vmware-vmx.exe 22116 [ws@4413 threadName="mks"] DX12Module: StandardSwizzle64KBSupported = false
2025-12-14T09:04:59.563Z -INFO vmware-vmx.exe 22116 [ws@4413 threadName="mks"] DX12Module: CrossNodeSharingTier = D3D12_CROSS_NODE_SHARING_TIER_NOT_SUPPORTED
2025-12-14T09:04:59.563Z -INFO vmware-vmx.exe 22116 [ws@4413 threadName="mks"] DX12Module: CrossAdapterRowMajorTextureSupported = false
2025-12-14T09:04:59.563Z -INFO vmware-vmx.exe 22116 [ws@4413 threadName="mks"] DX12Module: VPAndRTArrayIndexFromAnyShaderFeedingRasterizerSupportedWithoutGSEmulation = true
2025-12-14T09:04:59.563Z -INFO vmware-vmx.exe 22116 [ws@4413 threadName="mks"] DX12Module: ResourceHeapTier = D3D12_RESOURCE_HEAP_TIER_1
2025-12-14T09:04:59.563Z -INFO vmware-vmx.exe 22116 [ws@4413 threadName="mks"] DX12Module: D3D12_FEATURE_DATA_D3D12_OPTIONS4:
2025-12-14T09:04:59.563Z -INFO vmware-vmx.exe 22116 [ws@4413 threadName="mks"] DX12Module: MSAA64KBAlignedTextureSupported = true
2025-12-14T09:04:59.563Z -INFO vmware-vmx.exe 22116 [ws@4413 threadName="mks"] DX12Module: SharedResourceCompatSSlityTier = D3D12_SHARED_RESOURCE_COMPATSSLITY_TIER_2
2025-12-14T09:04:59.563Z -INFO vmware-vmx.exe 22116 [ws@4413 threadName="mks"] DX12Module: Native16BitShaderOpsSupported = false
2025-12-14T09:04:59.563Z -INFO vmware-vmx.exe 22116 [ws@4413 threadName="mks"] DX12Module: D3D12_FEATURE_DATA_D3D12_OPTIONS8:
2025-12-14T09:04:59.563Z -INFO vmware-vmx.exe 22116 [ws@4413 threadName="mks"] DX12Module: UnalignedBlockTexturesSupported = true
2025-12-14T09:04:59.563Z -INFO vmware-vmx.exe 22116 [ws@4413 threadName="mks"] DX12Module: D3D12_FEATURE_DATA_D3D12_OPTIONS13:
2025-12-14T09:04:59.563Z -INFO vmware-vmx.exe 22116 [ws@4413 threadName="mks"] DX12Module: UnrestrictedBufferTextureCopyPitchSupported = true
2025-12-14T09:04:59.563Z -INFO vmware-vmx.exe 22116 [ws@4413 threadName="mks"] DX12Module: UnrestrictedVertexElementAlignmentSupported = true
2025-12-14T09:04:59.563Z -INFO vmware-vmx.exe 22116 [ws@4413 threadName="mks"] DX12Module: InvertedViewportHeightFlipsYSupported = true
2025-12-14T09:04:59.563Z -INFO vmware-vmx.exe 22116 [ws@4413 threadName="mks"] DX12Module: InvertedViewportDepthFlipsZSupported = true
2025-12-14T09:04:59.563Z -INFO vmware-vmx.exe 22116 [ws@4413 threadName="mks"] DX12Module: TextureCopyBetweenDimensionsSupported = true
2025-12-14T09:04:59.563Z -INFO vmware-vmx.exe 22116 [ws@4413 threadName="mks"] DX12Module: AlphaBlendFactorSupported = true
2025-12-14T09:04:59.563Z -INFO vmware-vmx.exe 22116 [ws@4413 threadName="mks"] DX12Module: D3D12_FEATURE_DATA_ARCHITECTURE1:
2025-12-14T09:04:59.563Z -INFO vmware-vmx.exe 22116 [ws@4413 threadName="mks"] DX12Module: NodeIndex = 0
2025-12-14T09:04:59.563Z -INFO vmware-vmx.exe 22116 [ws@4413 threadName="mks"] DX12Module: TileBasedRenderer = false
2025-12-14T09:04:59.563Z -INFO vmware-vmx.exe 22116 [ws@4413 threadName="mks"] DX12Module: UMA = false
2025-12-14T09:04:59.563Z -INFO vmware-vmx.exe 22116 [ws@4413 threadName="mks"] DX12Module: CacheCoherentUMA = false
2025-12-14T09:04:59.563Z -INFO vmware-vmx.exe 22116 [ws@4413 threadName="mks"] DX12Module: IsolatedMMU = true
2025-12-14T09:04:59.563Z -INFO vmware-vmx.exe 22116 [ws@4413 threadName="mks"] DX12Module: D3D12_FEATURE_DATA_GPU_VIRTUAL_ADDRESS_SUPPORT:
2025-12-14T09:04:59.563Z -INFO vmware-vmx.exe 22116 [ws@4413 threadName="mks"] DX12Module: MaxGPUVirtualAddressBitsPerResource = 40
2025-12-14T09:04:59.563Z -INFO vmware-vmx.exe 22116 [ws@4413 threadName="mks"] DX12Module: MaxGPUVirtualAddressBitsPerProcess = 40
2025-12-14T09:04:59.563Z -INFO vmware-vmx.exe 22116 [ws@4413 threadName="mks"] DX12Module: max support shader model = D3D_SHADER_MODEL_6_4
2025-12-14T09:04:59.563Z -INFO vmware-vmx.exe 22116 [ws@4413 threadName="mks"] DX12Module: D3D12_FEATURE_DATA_EXISTING_HEAPS:
2025-12-14T09:04:59.563Z -INFO vmware-vmx.exe 22116 [ws@4413 threadName="mks"] DX12Module: Supported = true
2025-12-14T09:04:59.630Z -INFO vmware-vmx.exe 22116 [ws@4413 threadName="mks"] MKS-HWinMux: Started DX12 presentation backend.
2025-12-14T09:04:59.630Z -INFO vmware-vmx.exe 22116 [ws@4413 threadName="svga"] SWBScreen: Screen 0 Defined: xywh(0, 0, 640, 480) flags=0x3
2025-12-14T09:04:59.637Z -INFO vmware-vmx.exe 22116 [ws@4413 threadName="mks"] SWBWindow: Window #0 validation failed: no valid host window or host surface.
2025-12-14T09:04:59.637Z -INFO vmware-vmx.exe 22116 [ws@4413 threadName="mks"] SWBVmdb: Destroy SWB Window Id #0 because an invalid MKSWindow definition is received from UI over VMDB.
2025-12-14T09:04:59.637Z -INFO vmware-vmx.exe 22116 [ws@4413 threadName="mks"] SWBWindow: Window 0 Destroyed DESTROYED: src screenId=-1, src xywh(0, 0, 3838, 1997) dest xywh(0, 0, 3838, 1997) pixelScale=1, flags=0x HAS_HOST_ORIGIN ALLOW_MKS_GRAB IS_RENDERING
2025-12-14T09:04:59.648Z -INFO vmware-vmx.exe 22116 [ws@4413 threadName="mks"] SWBWindow: Number of MKSWindows changed: 0 rendering MKSWindow(s) of total 1.
2025-12-14T09:04:59.648Z -INFO vmware-vmx.exe 22116 [ws@4413 threadName="mks"] MKS-VMDB: VMDB requested a screenshot
2025-12-14T09:04:59.648Z -INFO vmware-vmx.exe 22116 [ws@4413 threadName="svga"] MKSScreenShotMgr: Taking a screenshot
2025-12-14T09:04:59.667Z -INFO vmware-vmx.exe 22116 [ws@4413 threadName="mks"] SWBWindow: Number of MKSWindows changed: 1 rendering MKSWindow(s) of total 2.
2025-12-14T09:04:59.667Z -INFO vmware-vmx.exe 22116 [ws@4413 threadName="mks"] SWBWindow: Window 0 Defined CREATED: src screenId=-1, src xywh(0, 0, 640, 480) dest xywh(0, 0, 640, 480) pixelScale=1, flags=0x HAS_HOST_ORIGIN ALLOW_MKS_GRAB IS_RENDERING
2025-12-14T09:04:59.701Z -INFO vmware-vmx.exe 22116 [ws@4413 threadName="vcpu-0"] SVGA: FIFO is already mapped
2025-12-14T09:04:59.712Z -INFO vmware-vmx.exe 22116 [ws@4413 threadName="vmx"] VNET: MACVNetLinkStateTimerHandler: 'ethernet0' state from 6 to 1.
2025-12-14T09:04:59.789Z -INFO vmware-vmx.exe 22116 [ws@4413 threadName="vcpu-0"] AHCI: Tried to enable/disable IO space.
2025-12-14T09:04:59.792Z -INFO vmware-vmx.exe 22116 [ws@4413 threadName="svga"] MKS: Renderer adapter luid = 0xDAFA
2025-12-14T09:04:59.804Z -INFO vmware-vmx.exe 22116 [ws@4413 threadName="vcpu-0"] AHCI: Tried to enable/disable IO space.
2025-12-14T09:04:59.804Z -INFO vmware-vmx.exe 22116 [ws@4413 threadName="vcpu-0"] AHCI-VMM:HBA reset issued on sata0.
2025-12-14T09:04:59.812Z -INFO vmware-vmx.exe 22116 [ws@4413 threadName="vcpu-0"] DISKUTIL: scsi0:0 : geometry=5221/255/63
2025-12-14T09:04:59.812Z -INFO vmware-vmx.exe 22116 [ws@4413 threadName="vcpu-0"] DISKUTIL: scsi0:0 : capacity=83886080 logical sector size=512
2025-12-14T09:05:00.012Z -INFO vmware-vmx.exe 22116 [ws@4413 threadName="vmx"] USB: New set of 2 USB devices.
2025-12-14T09:05:00.012Z -INFO vmware-vmx.exe 22116 [ws@4413 threadName="vmx"] USB: Found device [name:Logitech\ Mono\ H650e vid:046d pid:0a47 path:1/0/9 speed:full family:audio,hid instanceId:USB\\VID_046D&PID_0A47\\00000000 serialnum:00000000 arbRuntimeKey:3 version:5]
2025-12-14T09:05:00.012Z -INFO vmware-vmx.exe 22116 [ws@4413 threadName="vmx"] USB: Found device [name:Yubico.com\ YubiKey\ OTP vid:1050 pid:0401 path:1/0/11 speed:full family:hid,hid-bootable instanceId:USB\\VID_1050&PID_0401\\5&1C5CE6EE&0&12 arbRuntimeKey:4 quirks:allow version:5]
2025-12-14T09:05:00.073Z -INFO vmware-vmx.exe 22116 [ws@4413 threadName="vcpu-0"] AHCI-USER: Already in check condition 02 3a 00
2025-12-14T09:05:00.073Z -INFO vmware-vmx.exe 22116 [ws@4413 threadName="vcpu-0"] AHCI-USER: Already in check condition 02 3a 00
2025-12-14T09:05:00.078Z -INFO vmware-vmx.exe 22116 [ws@4413 threadName="vcpu-1"] CPU reset: soft (mode Emulation)
2025-12-14T09:05:00.084Z -INFO vmware-vmx.exe 22116 [ws@4413 threadName="vcpu-0"] BIOS-UUID is 56 4d f0 8b ad d3 df b8-cb a2 68 74 a9 93 5d 93
2025-12-14T09:05:00.156Z -INFO vmware-vmx.exe 22116 [ws@4413 threadName="vcpu-0"] AHCI-USER: Already in check condition 02 3a 00
2025-12-14T09:05:00.156Z -INFO vmware-vmx.exe 22116 [ws@4413 threadName="vcpu-0"] AHCI-USER: Already in check condition 02 3a 00
2025-12-14T09:05:00.156Z -INFO vmware-vmx.exe 22116 [ws@4413 threadName="vcpu-0"] AHCI-USER: Already in check condition 02 3a 00
2025-12-14T09:05:00.156Z -INFO vmware-vmx.exe 22116 [ws@4413 threadName="vcpu-0"] AHCI-USER: Already in check condition 02 3a 00
2025-12-14T09:05:00.156Z -INFO vmware-vmx.exe 22116 [ws@4413 threadName="vcpu-0"] AHCI-USER: Already in check condition 02 3a 00
2025-12-14T09:05:00.156Z -INFO vmware-vmx.exe 22116 [ws@4413 threadName="vcpu-0"] AHCI-USER: Already in check condition 02 3a 00
2025-12-14T09:05:00.156Z -INFO vmware-vmx.exe 22116 [ws@4413 threadName="vcpu-0"] AHCI-USER: Already in check condition 02 3a 00
2025-12-14T09:05:00.156Z -INFO vmware-vmx.exe 22116 [ws@4413 threadName="vcpu-0"] AHCI-USER: Already in check condition 02 3a 00
2025-12-14T09:05:00.156Z -INFO vmware-vmx.exe 22116 [ws@4413 threadName="vcpu-0"] AHCI-USER: Already in check condition 02 3a 00
2025-12-14T09:05:00.156Z -INFO vmware-vmx.exe 22116 [ws@4413 threadName="vcpu-0"] AHCI-USER: Already in check condition 02 3a 00
2025-12-14T09:05:00.156Z -INFO vmware-vmx.exe 22116 [ws@4413 threadName="vcpu-0"] AHCI-USER: Already in check condition 02 3a 00
2025-12-14T09:05:00.156Z -INFO vmware-vmx.exe 22116 [ws@4413 threadName="vcpu-0"] AHCI-USER: Already in check condition 02 3a 00
2025-12-14T09:05:00.156Z -INFO vmware-vmx.exe 22116 [ws@4413 threadName="vcpu-0"] AHCI-USER: Already in check condition 02 3a 00
2025-12-14T09:05:00.156Z -INFO vmware-vmx.exe 22116 [ws@4413 threadName="vcpu-0"] AHCI-USER: Already in check condition 02 3a 00
2025-12-14T09:05:00.156Z -INFO vmware-vmx.exe 22116 [ws@4413 threadName="vcpu-0"] AHCI-USER: Already in check condition 02 3a 00
2025-12-14T09:05:00.156Z -INFO vmware-vmx.exe 22116 [ws@4413 threadName="vcpu-0"] AHCI-USER: Already in check condition 02 3a 00
2025-12-14T09:05:00.166Z -INFO vmware-vmx.exe 22116 [ws@4413 threadName="svga"] SWBScreen: Screen 0 Resized: xywh(0, 0, 720, 400) flags=0x3
2025-12-14T09:05:00.439Z -INFO vmware-vmx.exe 22116 [ws@4413 threadName="vcpu-0"] DDB: "longContentID" = "58454d38b7919c82118a9ed6f31697ca" (was "56078b828af46995e948c2d24a2dfdf3")
2025-12-14T09:05:00.444Z -INFO vmware-vmx.exe 22116 [ws@4413 threadName="vcpu-0"] SVGA: FIFO is already mapped
2025-12-14T09:05:00.444Z -INFO vmware-vmx.exe 22116 [ws@4413 threadName="svga"] SVGA enabling SVGA
2025-12-14T09:05:00.444Z -INFO vmware-vmx.exe 22116 [ws@4413 threadName="svga"] SWBScreen: Screen 0 Destroyed: xywh(0, 0, 720, 400) flags=0x3
2025-12-14T09:05:00.446Z -INFO vmware-vmx.exe 22116 [ws@4413 threadName="svga"] SVGA-ScreenMgr: Screen type changed to RegisterMode
2025-12-14T09:05:00.446Z -INFO vmware-vmx.exe 22116 [ws@4413 threadName="svga"] SWBScreen: Screen 1 Defined: xywh(0, 0, 1024, 768) flags=0x2
2025-12-14T09:05:01.766Z -INFO vmware-vmx.exe 22116 [ws@4413 threadName="vcpu-1"] CPU reset: soft (mode Emulation)
2025-12-14T09:05:02.082Z -INFO vmware-vmx.exe 22116 [ws@4413 threadName="vcpu-0"] Preparing for SPEC_CTRL Guest MSR write (0x48) passthrough.
2025-12-14T09:05:03.024Z -INFO vmware-vmx.exe 22116 [ws@4413 threadName="vcpu-1"] SVGA: Unregistering IOSpace at 0x1070
2025-12-14T09:05:03.024Z -INFO vmware-vmx.exe 22116 [ws@4413 threadName="vcpu-1"] SVGA: Unregistering MemSpace at 0xe8000000(0xe8000000) and 0xfe000000(0xfe000000)
2025-12-14T09:05:03.025Z -INFO vmware-vmx.exe 22116 [ws@4413 threadName="vcpu-1"] SVGA: FIFO is already mapped
2025-12-14T09:05:03.025Z -INFO vmware-vmx.exe 22116 [ws@4413 threadName="vcpu-1"] SVGA: Registering IOSpace at 0x1070
2025-12-14T09:05:03.025Z -INFO vmware-vmx.exe 22116 [ws@4413 threadName="vcpu-1"] SVGA: Registering MemSpace at 0xe8000000(0xe8000000) and 0xfe000000(0xfe000000)
2025-12-14T09:05:03.025Z -INFO vmware-vmx.exe 22116 [ws@4413 threadName="vcpu-1"] SVGA: FIFO is already mapped
2025-12-14T09:05:04.354Z -INFO vmware-vmx.exe 22116 [ws@4413 threadName="vcpu-1"] Guest: Driver=vsock, Version=9.8.24.0
2025-12-14T09:05:04.362Z -INFO vmware-vmx.exe 22116 [ws@4413 threadName="vcpu-1"] Guest: Driver=vmci, Version=9.8.30.0
2025-12-14T09:05:04.365Z -INFO vmware-vmx.exe 22116 [ws@4413 threadName="vcpu-1"] VMCI: Capabilities in use by device: 0xc.
2025-12-14T09:05:04.406Z -INFO vmware-vmx.exe 22116 [ws@4413 threadName="vcpu-1"] SCSI0: RESET BUS
2025-12-14T09:05:04.407Z -INFO vmware-vmx.exe 22116 [ws@4413 threadName="vcpu-1"] LSI: Invalid PageType [21] pageNo 0 Action 0
2025-12-14T09:05:04.412Z -INFO vmware-vmx.exe 22116 [ws@4413 threadName="vcpu-1"] SCSI scsi0:0: Unsupported command REPORT LUNS issued. --ok
2025-12-14T09:05:04.514Z -INFO vmware-vmx.exe 22116 [ws@4413 threadName="vcpu-1"] AHCI-VMM:HBA reset issued on sata0.
2025-12-14T09:05:05.131Z -INFO vmware-vmx.exe 22116 [ws@4413 threadName="vcpu-0"] Tools: Running status rpc handler: 0 => 1.
2025-12-14T09:05:05.131Z -INFO vmware-vmx.exe 22116 [ws@4413 threadName="vcpu-0"] Tools: Changing running status: 0 => 1.
2025-12-14T09:05:05.131Z -INFO vmware-vmx.exe 22116 [ws@4413 threadName="vcpu-0"] Tools: [RunningStatus] Last heartbeat value 1 (last received 0s ago)
2025-12-14T09:05:05.131Z -INFO vmware-vmx.exe 22116 [ws@4413 threadName="vcpu-0"] Tools: Removing Tools inactivity timer.
2025-12-14T09:05:06.350Z -INFO vmware-vmx.exe 22116 [ws@4413 threadName="vcpu-1"] DISKUTIL: scsi0:0 : capacity=83886080 logical sector size=512
2025-12-14T09:05:06.350Z -INFO vmware-vmx.exe 22116 [ws@4413 threadName="vcpu-0"] SCSI DEVICE (scsi0:0): MODE SENSE(6) for unsupported page 0x1c
2025-12-14T09:05:06.351Z -INFO vmware-vmx.exe 22116 [ws@4413 threadName="vcpu-1"] SCSI DEVICE (scsi0:0): MODE SENSE(6) for unsupported page 0x8
2025-12-14T09:05:06.351Z -INFO vmware-vmx.exe 22116 [ws@4413 threadName="vcpu-1"] SCSI DEVICE (scsi0:0): MODE SENSE(6) for unsupported page 0x8
2025-12-14T09:05:06.351Z -INFO vmware-vmx.exe 22116 [ws@4413 threadName="vcpu-1"] DISKUTIL: scsi0:0 : capacity=83886080 logical sector size=512
2025-12-14T09:05:06.351Z -INFO vmware-vmx.exe 22116 [ws@4413 threadName="vcpu-1"] DISKUTIL: scsi0:0 : capacity=83886080 logical sector size=512
2025-12-14T09:05:06.352Z -INFO vmware-vmx.exe 22116 [ws@4413 threadName="vcpu-0"] DISKUTIL: scsi0:0 : capacity=83886080 logical sector size=512
2025-12-14T09:05:06.352Z -INFO vmware-vmx.exe 22116 [ws@4413 threadName="vcpu-1"] DISKUTIL: scsi0:0 : capacity=83886080 logical sector size=512
2025-12-14T09:05:13.525Z -INFO vmware-vmx.exe 22116 [ws@4413 threadName="vcpu-1"] DISKUTIL: scsi0:0 : capacity=83886080 logical sector size=512
2025-12-14T09:05:13.932Z -INFO vmware-vmx.exe 22116 [ws@4413 threadName="vcpu-1"] Guest: vm3d: WDDM Miniport Loading the release build type
2025-12-14T09:05:13.951Z -INFO vmware-vmx.exe 22116 [ws@4413 threadName="vcpu-1"] Guest: vm3d: Driver=wddm, Version=9.17.09.0004
2025-12-14T09:05:14.046Z -INFO vmware-vmx.exe 22116 [ws@4413 threadName="vcpu-1"] SVGA: Unregistering IOSpace at 0x1070
2025-12-14T09:05:14.046Z -INFO vmware-vmx.exe 22116 [ws@4413 threadName="vcpu-1"] SVGA: Unregistering MemSpace at 0xe8000000(0xe8000000) and 0xfe000000(0xfe000000)
2025-12-14T09:05:14.046Z -INFO vmware-vmx.exe 22116 [ws@4413 threadName="vcpu-1"] SVGA: FIFO is already mapped
2025-12-14T09:05:14.046Z -INFO vmware-vmx.exe 22116 [ws@4413 threadName="vcpu-1"] SVGA: Registering IOSpace at 0x1070
2025-12-14T09:05:14.046Z -INFO vmware-vmx.exe 22116 [ws@4413 threadName="vcpu-1"] SVGA: Registering MemSpace at 0xe8000000(0xe8000000) and 0xfe000000(0xfe000000)
2025-12-14T09:05:14.047Z -INFO vmware-vmx.exe 22116 [ws@4413 threadName="vcpu-1"] SVGA: FIFO is already mapped
2025-12-14T09:05:16.173Z -INFO vmware-vmx.exe 22116 [ws@4413 threadName="vcpu-1"] CDROM: Emulate GET CONFIGURATION RT 0 starting feature 0
2025-12-14T09:05:16.173Z -INFO vmware-vmx.exe 22116 [ws@4413 threadName="vcpu-1"] CDROM: Emulate GET CONFIGURATION RT 2 starting feature 0
2025-12-14T09:05:16.173Z -INFO vmware-vmx.exe 22116 [ws@4413 threadName="vcpu-1"] CDROM: Emulate GET CONFIGURATION RT 0 starting feature 0
2025-12-14T09:05:16.173Z -INFO vmware-vmx.exe 22116 [ws@4413 threadName="vcpu-1"] CDROM: Emulate GET CONFIGURATION RT 0 starting feature 0
2025-12-14T09:05:16.173Z -INFO vmware-vmx.exe 22116 [ws@4413 threadName="vcpu-1"] CDROM: Unknown command 0xA4.
2025-12-14T09:05:16.173Z -INFO vmware-vmx.exe 22116 [ws@4413 threadName="vcpu-1"] CDROM sata0:1: CMD 0xa4 (*UNKNOWN (0xa4)*) FAILED (key 0x5 asc 0x20 ascq 0)
2025-12-14T09:05:16.211Z -INFO vmware-vmx.exe 22116 [ws@4413 threadName="vcpu-0"] CDROM: Emulate GET CONFIGURATION RT 1 starting feature 0
2025-12-14T09:05:16.221Z -WARNING vmware-vmx.exe 22116 [ws@4413 threadName="vcpu-1"] HDAudio: HDAudioControllerReset: RIRB run bit is set.
2025-12-14T09:05:16.237Z -INFO vmware-vmx.exe 22116 [ws@4413 threadName="vcpu-1"] PCIXHCI: Interrupt type changed from INTX to MSIX
2025-12-14T09:05:16.322Z -INFO vmware-vmx.exe 22116 [ws@4413 threadName="vcpu-1"] E1000: e1000e-- tx queue 1 is enabled.
2025-12-14T09:05:16.322Z -INFO vmware-vmx.exe 22116 [ws@4413 threadName="vcpu-1"] E1000: e1000e-- tx queue 1 is enabled.
2025-12-14T09:05:16.322Z -INFO vmware-vmx.exe 22116 [ws@4413 threadName="vcpu-1"] E1000: e1000e-- tx queue 1 is enabled.
2025-12-14T09:05:16.322Z -INFO vmware-vmx.exe 22116 [ws@4413 threadName="vcpu-1"] E1000: e1000e-- tx queue 1 is enabled.
2025-12-14T09:05:16.322Z -INFO vmware-vmx.exe 22116 [ws@4413 threadName="vcpu-1"] E1000: e1000e-- tx queue 1 is enabled.
2025-12-14T09:05:16.322Z -INFO vmware-vmx.exe 22116 [ws@4413 threadName="vcpu-1"] E1000: e1000e-- tx queue 1 is enabled.
2025-12-14T09:05:16.322Z -INFO vmware-vmx.exe 22116 [ws@4413 threadName="vcpu-1"] E1000: e1000e-- tx queue 1 is enabled.
2025-12-14T09:05:16.322Z -INFO vmware-vmx.exe 22116 [ws@4413 threadName="vcpu-1"] E1000: e1000e-- tx queue 1 is enabled.
2025-12-14T09:05:16.322Z -INFO vmware-vmx.exe 22116 [ws@4413 threadName="vcpu-1"] E1000: e1000e-- tx queue 1 is enabled.
2025-12-14T09:05:16.322Z -INFO vmware-vmx.exe 22116 [ws@4413 threadName="vcpu-1"] E1000: e1000e-- tx queue 1 is enabled.
2025-12-14T09:05:16.322Z -INFO vmware-vmx.exe 22116 [ws@4413 threadName="vcpu-1"] E1000: e1000e-- tx queue 1 is enabled.
2025-12-14T09:05:16.322Z -INFO vmware-vmx.exe 22116 [ws@4413 threadName="vcpu-1"] E1000: e1000e-- tx queue 1 is enabled.
2025-12-14T09:05:16.323Z -INFO vmware-vmx.exe 22116 [ws@4413 threadName="vcpu-1"] E1000: e1000e-- tx queue 1 is enabled.
2025-12-14T09:05:16.323Z -INFO vmware-vmx.exe 22116 [ws@4413 threadName="vcpu-1"] E1000: e1000e-- tx queue 1 is enabled.
2025-12-14T09:05:16.323Z -INFO vmware-vmx.exe 22116 [ws@4413 threadName="vcpu-1"] E1000: e1000e-- tx queue 1 is enabled.
2025-12-14T09:05:16.323Z -INFO vmware-vmx.exe 22116 [ws@4413 threadName="vcpu-1"] E1000: e1000e-- tx queue 1 is enabled.
2025-12-14T09:05:16.327Z -INFO vmware-vmx.exe 22116 [ws@4413 threadName="vcpu-1"] E1000: e1000e-- tx queue 1 is enabled.
2025-12-14T09:05:16.328Z -INFO vmware-vmx.exe 22116 [ws@4413 threadName="vcpu-1"] E1000: e1000e-- tx queue 1 is enabled.
2025-12-14T09:05:16.328Z -INFO vmware-vmx.exe 22116 [ws@4413 threadName="vcpu-1"] E1000: e1000e-- tx queue 1 is enabled.
2025-12-14T09:05:16.328Z -INFO vmware-vmx.exe 22116 [ws@4413 threadName="vcpu-1"] E1000: e1000e-- tx queue 1 is enabled.
2025-12-14T09:05:16.328Z -INFO vmware-vmx.exe 22116 [ws@4413 threadName="vcpu-1"] E1000: e1000e-- tx queue 1 is enabled.
2025-12-14T09:05:16.334Z -INFO vmware-vmx.exe 22116 [ws@4413 threadName="vcpu-1"] E1000: e1000e-- tx queue 1 is enabled.
2025-12-14T09:05:16.336Z -INFO vmware-vmx.exe 22116 [ws@4413 threadName="vcpu-1"] E1000: e1000e-- tx queue 1 is enabled.
2025-12-14T09:05:17.097Z -INFO vmware-vmx.exe 22116 [ws@4413 threadName="vmx"] VNET: MACVNetLinkStateTimerHandler: 'ethernet0' state from 1 to 5.
2025-12-14T09:05:26.600Z -INFO vmware-vmx.exe 22116 [ws@4413 threadName="vcpu-1"] PCIXHCI: Interrupt type changed from MSIX to INTX
2025-12-14T09:05:26.663Z -INFO vmware-vmx.exe 22116 [ws@4413 threadName="vcpu-1"] PCIXHCI: Interrupt type changed from INTX to MSIX
2025-12-14T09:05:30.594Z -INFO vmware-vmx.exe 22116 [ws@4413 threadName="vcpu-1"] DISKUTIL: scsi0:0 : capacity=83886080 logical sector size=512
2025-12-14T09:05:30.682Z -INFO vmware-vmx.exe 22116 [ws@4413 threadName="vcpu-1"] Guest: vm3d: SVGA WDDM Full Display driver, Version: 9.17.09.0004, Build Number: 24449046 Device: SVGA2
2025-12-14T09:05:30.682Z -INFO vmware-vmx.exe 22116 [ws@4413 threadName="vcpu-1"] Guest: vm3d: WDDM OS version: 10.0, build number: 19045, service pack version: 0.0, platform Id: 2, product type: 1, suite mask: 0x110
2025-12-14T09:05:30.682Z -INFO vmware-vmx.exe 22116 [ws@4413 threadName="vcpu-1"] SVGA: FIFO is already mapped
2025-12-14T09:05:30.682Z -INFO vmware-vmx.exe 22116 [ws@4413 threadName="vcpu-1"] SVGA: FIFO is already mapped
2025-12-14T09:05:30.682Z -INFO vmware-vmx.exe 22116 [ws@4413 threadName="vcpu-1"] SVGA: FIFO is already mapped
2025-12-14T09:05:30.682Z -INFO vmware-vmx.exe 22116 [ws@4413 threadName="vcpu-1"] SVGA: FIFO is already mapped
2025-12-14T09:05:30.683Z -INFO vmware-vmx.exe 22116 [ws@4413 threadName="svga"] SWBScreen: Screen 1 Destroyed: xywh(0, 0, 1024, 768) flags=0x2
2025-12-14T09:05:30.683Z -INFO vmware-vmx.exe 22116 [ws@4413 threadName="svga"] SWBScreen: Screen 1 Defined: xywh(0, 0, 1024, 768) flags=0x2
2025-12-14T09:05:30.687Z -INFO vmware-vmx.exe 22116 [ws@4413 threadName="vcpu-1"] Guest: vm3d: WDDM SVGA Grow OTable command is on.
2025-12-14T09:05:30.687Z -INFO vmware-vmx.exe 22116 [ws@4413 threadName="vcpu-1"] Guest: vm3d: WDDM SVGA IntraSurfaceCopy command is on.
2025-12-14T09:05:30.687Z -INFO vmware-vmx.exe 22116 [ws@4413 threadName="vcpu-1"] Guest: vm3d: WDDM Guest backed surface is on.
2025-12-14T09:05:30.687Z -INFO vmware-vmx.exe 22116 [ws@4413 threadName="vcpu-1"] Guest: vm3d: WDDM Large cursor support is off.
2025-12-14T09:05:30.689Z -INFO vmware-vmx.exe 22116 [ws@4413 threadName="vcpu-1"] Guest: vm3d: WDDM Frame Type is off.
2025-12-14T09:05:30.695Z -INFO vmware-vmx.exe 22116 [ws@4413 threadName="vcpu-1"] Guest: vm3d: WDDM SVGA FL11_0 (SM5) support is off.
2025-12-14T09:05:30.695Z -INFO vmware-vmx.exe 22116 [ws@4413 threadName="vcpu-1"] Guest: vm3d: WDDM 3D is on.
2025-12-14T09:05:30.695Z -INFO vmware-vmx.exe 22116 [ws@4413 threadName="vcpu-1"] Guest: vm3d: WDDM DX10 context is on.
2025-12-14T09:05:30.695Z -INFO vmware-vmx.exe 22116 [ws@4413 threadName="vcpu-1"] Guest: vm3d: WDDM GL3 is on.
2025-12-14T09:05:30.695Z -INFO vmware-vmx.exe 22116 [ws@4413 threadName="vcpu-1"] Guest: vm3d: WDDM DX cap is on.
2025-12-14T09:05:30.695Z -INFO vmware-vmx.exe 22116 [ws@4413 threadName="vcpu-1"] Guest: vm3d: WDDM HP Queue is on.
2025-12-14T09:05:30.695Z -INFO vmware-vmx.exe 22116 [ws@4413 threadName="vcpu-1"] Guest: vm3d: WDDM GDI HW emulation is enabled.
2025-12-14T09:05:30.696Z -INFO vmware-vmx.exe 22116 [ws@4413 threadName="vcpu-1"] Guest: vm3d: WDDM Guest backed primary in aperture is on.
2025-12-14T09:05:30.696Z -INFO vmware-vmx.exe 22116 [ws@4413 threadName="vcpu-1"] SVGA: Guest reported SVGA WDDM driver version: 9.17.09.0004 Build Number: 24449046
2025-12-14T09:05:30.701Z -INFO vmware-vmx.exe 22116 [ws@4413 threadName="vcpu-1"] Guest: vm3d: WDDM EDID support is off.
2025-12-14T09:05:30.714Z -INFO vmware-vmx.exe 22116 [ws@4413 threadName="vcpu-1"] Guest: vm3d: Modeset enabled, types available: TR CCD Multi
2025-12-14T09:05:30.716Z -INFO vmware-vmx.exe 22116 [ws@4413 threadName="vcpu-1"] Guest: vm3d: WDDM VSync is on.
2025-12-14T09:05:30.716Z -INFO vmware-vmx.exe 22116 [ws@4413 threadName="vcpu-1"] Guest: vm3d: WDDM VSync Flip is on.
2025-12-14T09:05:30.716Z -INFO vmware-vmx.exe 22116 [ws@4413 threadName="vcpu-1"] Guest: vm3d: WDDM VSync Flip for DWM is off.
2025-12-14T09:05:30.717Z -INFO vmware-vmx.exe 22116 [ws@4413 threadName="vcpu-1"] Guest: vm3d: WDDM DevApi using ScreenDMA
2025-12-14T09:05:30.717Z -INFO vmware-vmx.exe 22116 [ws@4413 threadName="vcpu-1"] Guest: vm3d: WDDM DevApi cannot determine ScreenDMA support, output may be black
2025-12-14T09:05:30.719Z -INFO vmware-vmx.exe 22116 [ws@4413 threadName="vcpu-1"] Guest: vm3d: WDDM primary mem 262144KB.
2025-12-14T09:05:30.719Z -INFO vmware-vmx.exe 22116 [ws@4413 threadName="vcpu-1"] Guest: vm3d: WDDM VRAM 4096KB.
2025-12-14T09:05:30.719Z -INFO vmware-vmx.exe 22116 [ws@4413 threadName="svga"] SWBScreen: Screen 1 Destroyed: xywh(0, 0, 1024, 768) flags=0x2
2025-12-14T09:05:30.721Z -INFO vmware-vmx.exe 22116 [ws@4413 threadName="vcpu-1"] Guest: vm3d: WDDM using 156KB memory for OTable.
2025-12-14T09:05:30.722Z -INFO vmware-vmx.exe 22116 [ws@4413 threadName="vcpu-1"] Guest: vm3d: WDDM Aperture memory 2097152KB.
2025-12-14T09:05:30.723Z -INFO vmware-vmx.exe 22116 [ws@4413 threadName="vcpu-1"] Guest: vm3d: 1 monitors active
2025-12-14T09:05:30.777Z -INFO vmware-vmx.exe 22116 [ws@4413 threadName="svga"] SVGA-ScreenMgr: Screen type changed to ScreenTarget
2025-12-14T09:05:30.777Z -INFO vmware-vmx.exe 22116 [ws@4413 threadName="svga"] SWBScreen: Screen 1 Defined: xywh(0, 0, 3838, 1997) flags=0x2
2025-12-14T09:05:30.992Z -INFO vmware-vmx.exe 22116 [ws@4413 threadName="vcpu-0"] Guest MSR write (0x49: 0x1)
2025-12-14T09:05:34.256Z -INFO vmware-vmx.exe 22116 [ws@4413 threadName="vcpu-1"] E1000: e1000e-- tx queue 1 is enabled.
2025-12-14T09:05:34.260Z -INFO vmware-vmx.exe 22116 [ws@4413 threadName="vcpu-1"] E1000: e1000e-- tx queue 1 is enabled.
2025-12-14T09:05:34.261Z -INFO vmware-vmx.exe 22116 [ws@4413 threadName="vcpu-1"] E1000: e1000e-- tx queue 1 is enabled.
2025-12-14T09:05:34.278Z -INFO vmware-vmx.exe 22116 [ws@4413 threadName="vcpu-0"] CDROM: Emulate GET CONFIGURATION RT 2 starting feature 0
2025-12-14T09:05:34.278Z -INFO vmware-vmx.exe 22116 [ws@4413 threadName="vcpu-0"] CDROM: Emulate GET CONFIGURATION RT 2 starting feature 30
2025-12-14T09:05:34.278Z -INFO vmware-vmx.exe 22116 [ws@4413 threadName="vcpu-0"] CDROM: Emulate GET CONFIGURATION RT 2 starting feature 31
2025-12-14T09:05:34.278Z -INFO vmware-vmx.exe 22116 [ws@4413 threadName="vcpu-1"] CDROM: Emulate GET CONFIGURATION RT 2 starting feature 32
2025-12-14T09:05:34.278Z -INFO vmware-vmx.exe 22116 [ws@4413 threadName="vcpu-0"] CDROM: Emulate GET CONFIGURATION RT 2 starting feature 33
2025-12-14T09:05:34.278Z -INFO vmware-vmx.exe 22116 [ws@4413 threadName="vcpu-0"] CDROM: Emulate GET CONFIGURATION RT 2 starting feature 35
2025-12-14T09:05:34.279Z -INFO vmware-vmx.exe 22116 [ws@4413 threadName="vcpu-0"] CDROM: Emulate GET CONFIGURATION RT 2 starting feature 36
2025-12-14T09:05:34.279Z -INFO vmware-vmx.exe 22116 [ws@4413 threadName="vcpu-1"] CDROM: Emulate GET CONFIGURATION RT 2 starting feature 38
2025-12-14T09:05:34.279Z -INFO vmware-vmx.exe 22116 [ws@4413 threadName="vcpu-0"] CDROM: Emulate GET CONFIGURATION RT 2 starting feature 42
2025-12-14T09:05:34.279Z -INFO vmware-vmx.exe 22116 [ws@4413 threadName="vcpu-0"] CDROM: Emulate GET CONFIGURATION RT 2 starting feature 43
2025-12-14T09:05:34.279Z -INFO vmware-vmx.exe 22116 [ws@4413 threadName="vcpu-0"] CDROM: Emulate GET CONFIGURATION RT 2 starting feature 45
2025-12-14T09:05:34.279Z -INFO vmware-vmx.exe 22116 [ws@4413 threadName="vcpu-0"] CDROM: Emulate GET CONFIGURATION RT 2 starting feature 46
2025-12-14T09:05:34.279Z -INFO vmware-vmx.exe 22116 [ws@4413 threadName="vcpu-0"] CDROM: Emulate GET CONFIGURATION RT 2 starting feature 47
2025-12-14T09:05:34.279Z -INFO vmware-vmx.exe 22116 [ws@4413 threadName="vcpu-0"] CDROM: Emulate GET CONFIGURATION RT 2 starting feature 64
2025-12-14T09:05:34.279Z -INFO vmware-vmx.exe 22116 [ws@4413 threadName="vcpu-0"] CDROM: Emulate GET CONFIGURATION RT 2 starting feature 65
2025-12-14T09:05:34.279Z -INFO vmware-vmx.exe 22116 [ws@4413 threadName="vcpu-0"] CDROM: Emulate GET CONFIGURATION RT 2 starting feature 259
2025-12-14T09:05:35.306Z -INFO vmware-vmx.exe 22116 [ws@4413 threadName="vcpu-0"] E1000: e1000e-- tx queue 1 is enabled.
2025-12-14T09:05:35.308Z -INFO vmware-vmx.exe 22116 [ws@4413 threadName="vcpu-1"] E1000: e1000e-- tx queue 1 is enabled.
2025-12-14T09:05:36.436Z -INFO vmware-vmx.exe 22116 [ws@4413 threadName="vmx"] GuestRpc: Got RPCI vsocket connection 7, assigned to channel 0.
2025-12-14T09:05:36.436Z -INFO vmware-vmx.exe 22116 [ws@4413 threadName="vmx"] GuestRpc: Got RPCI vsocket connection 8, assigned to channel 1.
2025-12-14T09:05:36.497Z -INFO vmware-vmx.exe 22116 [ws@4413 threadName="vmx"] Guest: [vgauthservice] VGAuthService build-24843032 starting up
2025-12-14T09:05:36.497Z -INFO vmware-vmx.exe 22116 [ws@4413 threadName="vmx"] GuestRpc: Closing channel 1 connection 8
2025-12-14T09:05:36.613Z -INFO vmware-vmx.exe 22116 [ws@4413 threadName="vcpu-1"] Guest: Driver=vmhgfs, Version=11.0.49.0
2025-12-14T09:05:36.652Z -INFO vmware-vmx.exe 22116 [ws@4413 threadName="vmx"] GuestRpc: Got RPCI vsocket connection 9, assigned to channel 1.
2025-12-14T09:05:36.702Z -INFO vmware-vmx.exe 22116 [ws@4413 threadName="vmx"] Guest: [vgauthservice] SAML_Init: Using xmlsec1 1.3.5 for XML signature support
2025-12-14T09:05:36.702Z -INFO vmware-vmx.exe 22116 [ws@4413 threadName="vmx"] GuestRpc: Closing channel 1 connection 9
2025-12-14T09:05:36.715Z -INFO vmware-vmx.exe 22116 [ws@4413 threadName="vmx"] Guest: toolbox: Version: 13.0.1.0 (build-24843032)
2025-12-14T09:05:36.747Z -WARNING vmware-vmx.exe 22116 [ws@4413 threadName="vcpu-1"] GuestRpc: application toolbox, changing channel 65535 -> 0
2025-12-14T09:05:36.749Z -INFO vmware-vmx.exe 22116 [ws@4413 threadName="vcpu-1"] GuestRpc: Channel 0, guest application toolbox.
2025-12-14T09:05:36.749Z -INFO vmware-vmx.exe 22116 [ws@4413 threadName="vcpu-1"] Tools: [AppStatus] Last heartbeat value 5 (last received 1s ago)
2025-12-14T09:05:36.749Z -INFO vmware-vmx.exe 22116 [ws@4413 threadName="vcpu-1"] TOOLS: appName=toolbox, oldStatus=0, status=1, guestInitiated=0.
2025-12-14T09:05:36.872Z -INFO vmware-vmx.exe 22116 [ws@4413 threadName="vmx"] TOOLS autoupgrade protocol version 2
2025-12-14T09:05:36.890Z -INFO vmware-vmx.exe 22116 [ws@4413 threadName="vmx"] Tools: Changing running status: 1 => 2.
2025-12-14T09:05:36.890Z -INFO vmware-vmx.exe 22116 [ws@4413 threadName="vmx"] Tools: [RunningStatus] Last heartbeat value 5 (last received 1s ago)
2025-12-14T09:05:36.985Z -INFO vmware-vmx.exe 22116 [ws@4413 threadName="vmx"] TOOLS Received tools.set.versiontype rpc call, version = 13313, type = 1
2025-12-14T09:05:36.985Z -INFO vmware-vmx.exe 22116 [ws@4413 threadName="vmx"] Tools_SetVersionAndType did nothing; new tools version (13313) and type (1) match old Tools version and type
2025-12-14T09:05:36.985Z -INFO vmware-vmx.exe 22116 [ws@4413 threadName="vmx"] ToolsISO: Refreshing imageName for 'windows9-64' (refreshCount=1, lastCount=1).
2025-12-14T09:05:36.985Z -INFO vmware-vmx.exe 22116 [ws@4413 threadName="vmx"] ToolsISO: open of C:\Program Files (x86)\VMware\VMware Workstation\isoimages_manifest.txt.sig failed: Could not find the file
2025-12-14T09:05:36.985Z -INFO vmware-vmx.exe 22116 [ws@4413 threadName="vmx"] ToolsISO: Unable to read signature file 'C:\Program Files (x86)\VMware\VMware Workstation\isoimages_manifest.txt.sig', ignoring.
2025-12-14T09:05:36.986Z -INFO vmware-vmx.exe 22116 [ws@4413 threadName="vmx"] ToolsISO: Updated cached value for imageName to 'windows.iso'.
2025-12-14T09:05:36.986Z -INFO vmware-vmx.exe 22116 [ws@4413 threadName="vmx"] ToolsISO: Selected Tools ISO 'windows.iso' for 'windows9-64' guest.
2025-12-14T09:05:36.986Z -INFO vmware-vmx.exe 22116 [ws@4413 threadName="vmx"] TOOLS updated cached value for isoImageExists to 1.
2025-12-14T09:05:36.986Z -INFO vmware-vmx.exe 22116 [ws@4413 threadName="vmx"] Starting copy guest manifest.
2025-12-14T09:05:37.003Z -INFO vmware-vmx.exe 22116 [ws@4413 threadName="vmx"] Guest: Executing script for state change 'OS_PowerOn'.
2025-12-14T09:05:37.027Z -INFO vmware-vmx.exe 22116 [ws@4413 threadName="vcpu-0"] Tools: State change '3' progress: last event 0, event 1, success 1.
2025-12-14T09:05:37.027Z -INFO vmware-vmx.exe 22116 [ws@4413 threadName="vcpu-0"] HGFileCopyCreateSessionCB: Successfully created the session.
2025-12-14T09:05:37.042Z -INFO vmware-vmx.exe 22116 [ws@4413 threadName="vcpu-0"] ToolsLoadManifestFileCB: Queuing a request to update the manifest information.
2025-12-14T09:05:37.043Z -INFO vmware-vmx.exe 22116 [ws@4413 threadName="worker-21696"] ToolsISO: Refreshing imageName for 'windows9-64' (refreshCount=1, lastCount=1).
2025-12-14T09:05:37.044Z -INFO vmware-vmx.exe 22116 [ws@4413 threadName="worker-21696"] ToolsISO: open of C:\Program Files (x86)\VMware\VMware Workstation\isoimages_manifest.txt.sig failed: Could not find the file
2025-12-14T09:05:37.044Z -INFO vmware-vmx.exe 22116 [ws@4413 threadName="worker-21696"] ToolsISO: Unable to read signature file 'C:\Program Files (x86)\VMware\VMware Workstation\isoimages_manifest.txt.sig', ignoring.
2025-12-14T09:05:37.044Z -INFO vmware-vmx.exe 22116 [ws@4413 threadName="worker-21696"] ToolsISO: Updated cached value for imageName to 'windows.iso'.
2025-12-14T09:05:37.044Z -INFO vmware-vmx.exe 22116 [ws@4413 threadName="worker-21696"] ToolsISO: Selected Tools ISO 'windows.iso' for 'windows9-64' guest.
2025-12-14T09:05:37.044Z -INFO vmware-vmx.exe 22116 [ws@4413 threadName="worker-21696"] GetHostManifests: Extracting C:\Users\mb\AppData\Local\Temp\vmware-edv\manifest.txt.21696.iso.shipped manifest file.
2025-12-14T09:05:37.044Z -INFO vmware-vmx.exe 22116 [ws@4413 threadName="worker-21696"] ToolsISO: open of C:\Program Files (x86)\VMware\VMware Workstation\windows.iso.sha failed: Could not find the file
2025-12-14T09:05:37.044Z -INFO vmware-vmx.exe 22116 [ws@4413 threadName="worker-21696"] ToolsISO: Unable to read hash file C:\Program Files (x86)\VMware\VMware Workstation\windows.iso.sha, ignoring.
2025-12-14T09:05:37.045Z -INFO vmware-vmx.exe 22116 [ws@4413 threadName="worker-21696"] GetHostManifests: Done extracting the manifest file.
2025-12-14T09:05:37.045Z -INFO vmware-vmx.exe 22116 [ws@4413 threadName="worker-21696"] Win32U_GetFileAttributes: GetFileAttributesExW("C:\Program Files (x86)\VMware\VMware Workstation\windows_avr_manifest.txt", ...) failed, error: 2
2025-12-14T09:05:37.046Z -INFO vmware-vmx.exe 22116 [ws@4413 threadName="worker-21696"] Using ToolsMinVersion = 8384
2025-12-14T09:05:37.046Z -INFO vmware-vmx.exe 22116 [ws@4413 threadName="worker-21696"] Using ToolsMaxVersion = 13313
2025-12-14T09:05:37.046Z -INFO vmware-vmx.exe 22116 [ws@4413 threadName="worker-21696"] ToolsVersionGetStatusWorkerThread: Tools status 3 derived from environment
2025-12-14T09:05:37.046Z -INFO vmware-vmx.exe 22116 [ws@4413 threadName="vmx"] ToolsUpdateManifestInfoWorkerThreadDone: Compared tools manifest from host and from the guest. Status = 3.
2025-12-14T09:05:37.046Z -INFO vmware-vmx.exe 22116 [ws@4413 threadName="vmx"] ToolsUpdateManifestInfoWorkerThreadDone: Updating the manifest info.
2025-12-14T09:05:37.046Z -NOTICE vmware-vmx.exe 22116 [ws@4413 threadName="vmx"] ConfigDB: Setting extendedConfigFile = "SS.vmxf"
2025-12-14T09:05:37.053Z -INFO vmware-vmx.exe 22116 [ws@4413 threadName="vmx"] ToolsISO: Refreshing imageName for 'windows9-64' (refreshCount=1, lastCount=1).
2025-12-14T09:05:37.054Z -INFO vmware-vmx.exe 22116 [ws@4413 threadName="vmx"] ToolsISO: open of C:\Program Files (x86)\VMware\VMware Workstation\isoimages_manifest.txt.sig failed: Could not find the file
2025-12-14T09:05:37.054Z -INFO vmware-vmx.exe 22116 [ws@4413 threadName="vmx"] ToolsISO: Unable to read signature file 'C:\Program Files (x86)\VMware\VMware Workstation\isoimages_manifest.txt.sig', ignoring.
2025-12-14T09:05:37.054Z -INFO vmware-vmx.exe 22116 [ws@4413 threadName="vmx"] ToolsISO: Updated cached value for imageName to 'windows.iso'.
2025-12-14T09:05:37.054Z -INFO vmware-vmx.exe 22116 [ws@4413 threadName="vmx"] ToolsISO: Selected Tools ISO 'windows.iso' for 'windows9-64' guest.
2025-12-14T09:05:37.054Z -INFO vmware-vmx.exe 22116 [ws@4413 threadName="vmx"] TOOLS updated cached value for isoImageExists to 1.
2025-12-14T09:05:37.054Z -INFO vmware-vmx.exe 22116 [ws@4413 threadName="vmx"] VMXVmdb_SetToolsVersionStatus: status value set to 'ok', 'current', install possible
2025-12-14T09:05:37.054Z -INFO vmware-vmx.exe 22116 [ws@4413 threadName="vmx"] TOOLS installed legacy version 13313, available legacy version 13313
2025-12-14T09:05:37.054Z -INFO vmware-vmx.exe 22116 [ws@4413 threadName="vmx"] TOOLS manifest update status is 3
2025-12-14T09:05:37.054Z -INFO vmware-vmx.exe 22116 [ws@4413 threadName="vmx"] TOOLS can be autoupgraded.
2025-12-14T09:05:37.054Z -INFO vmware-vmx.exe 22116 [ws@4413 threadName="vmx"] TOOLS Setting autoupgrade-checked TRUE.
2025-12-14T09:05:37.209Z -INFO vmware-vmx.exe 22116 [ws@4413 threadName="vmx"] Guest: Script exit code: 0, success = 1
2025-12-14T09:05:37.232Z -INFO vmware-vmx.exe 22116 [ws@4413 threadName="vmx"] TOOLS state change 3 returned status 1
2025-12-14T09:05:37.232Z -INFO vmware-vmx.exe 22116 [ws@4413 threadName="vmx"] Tools: State change '3' progress: last event 1, event 2, success 1.
2025-12-14T09:05:37.232Z -INFO vmware-vmx.exe 22116 [ws@4413 threadName="vmx"] Tools: State change '3' progress: last event 1, event 4, success 1.
2025-12-14T09:05:37.232Z -INFO vmware-vmx.exe 22116 [ws@4413 threadName="vmx"] Vix: [mainDispatch.c:4089]: VMAutomationReportPowerStateChange: Reporting power state change (opcode=2, err=0).
2025-12-14T09:05:37.232Z -INFO vmware-vmx.exe 22116 [ws@4413 threadName="vmx"] Tools: Changing running status: 2 => 1.
2025-12-14T09:05:37.232Z -INFO vmware-vmx.exe 22116 [ws@4413 threadName="vmx"] Tools: [RunningStatus] Last heartbeat value 6 (last received 0s ago)
2025-12-14T09:05:37.985Z -INFO vmware-vmx.exe 22116 [ws@4413 threadName="vcpu-1"] SCSI DEVICE (scsi0:0): MODE SENSE(6) for unsupported page 0x8
2025-12-14T09:05:37.986Z -INFO vmware-vmx.exe 22116 [ws@4413 threadName="vcpu-1"] SCSI DEVICE (scsi0:0): MODE SENSE(6) for unsupported page 0x8
2025-12-14T09:05:37.987Z -INFO vmware-vmx.exe 22116 [ws@4413 threadName="vcpu-0"] SCSI DEVICE (scsi0:0): MODE SENSE(6) for unsupported page 0x8
2025-12-14T09:05:37.987Z -INFO vmware-vmx.exe 22116 [ws@4413 threadName="vcpu-0"] SCSI DEVICE (scsi0:0): MODE SENSE(6) for unsupported page 0x8
2025-12-14T09:05:38.009Z -INFO vmware-vmx.exe 22116 [ws@4413 threadName="vcpu-1"] SCSI DEVICE (scsi0:0): MODE SENSE(6) for unsupported page 0x8
2025-12-14T09:05:38.009Z -INFO vmware-vmx.exe 22116 [ws@4413 threadName="vcpu-1"] SCSI DEVICE (scsi0:0): MODE SENSE(6) for unsupported page 0x8
2025-12-14T09:05:38.010Z -INFO vmware-vmx.exe 22116 [ws@4413 threadName="vcpu-1"] SCSI DEVICE (scsi0:0): MODE SENSE(6) for unsupported page 0x8
2025-12-14T09:05:38.010Z -INFO vmware-vmx.exe 22116 [ws@4413 threadName="vcpu-1"] SCSI DEVICE (scsi0:0): MODE SENSE(6) for unsupported page 0x8
2025-12-14T09:05:38.012Z -INFO vmware-vmx.exe 22116 [ws@4413 threadName="vcpu-1"] SCSI DEVICE (scsi0:0): MODE SENSE(6) for unsupported page 0x8
2025-12-14T09:05:38.012Z -INFO vmware-vmx.exe 22116 [ws@4413 threadName="vcpu-1"] SCSI DEVICE (scsi0:0): MODE SENSE(6) for unsupported page 0x8
2025-12-14T09:05:38.360Z -INFO vmware-vmx.exe 22116 [ws@4413 threadName="vcpu-0"] SCSI DEVICE (scsi0:0): MODE SENSE(6) for unsupported page 0x8
2025-12-14T09:05:38.360Z -INFO vmware-vmx.exe 22116 [ws@4413 threadName="vcpu-0"] SCSI DEVICE (scsi0:0): MODE SENSE(6) for unsupported page 0x8
2025-12-14T09:05:38.362Z -INFO vmware-vmx.exe 22116 [ws@4413 threadName="vcpu-1"] SCSI DEVICE (scsi0:0): MODE SENSE(6) for unsupported page 0x8
2025-12-14T09:05:38.362Z -INFO vmware-vmx.exe 22116 [ws@4413 threadName="vcpu-1"] SCSI DEVICE (scsi0:0): MODE SENSE(6) for unsupported page 0x8
2025-12-14T09:05:38.368Z -INFO vmware-vmx.exe 22116 [ws@4413 threadName="vcpu-1"] SCSI DEVICE (scsi0:0): MODE SENSE(6) for unsupported page 0x8
2025-12-14T09:05:38.368Z -INFO vmware-vmx.exe 22116 [ws@4413 threadName="vcpu-1"] SCSI DEVICE (scsi0:0): MODE SENSE(6) for unsupported page 0x8
2025-12-14T09:05:38.370Z -INFO vmware-vmx.exe 22116 [ws@4413 threadName="vcpu-1"] SCSI DEVICE (scsi0:0): MODE SENSE(6) for unsupported page 0x8
2025-12-14T09:05:38.370Z -INFO vmware-vmx.exe 22116 [ws@4413 threadName="vcpu-1"] SCSI DEVICE (scsi0:0): MODE SENSE(6) for unsupported page 0x8
2025-12-14T09:05:38.371Z -INFO vmware-vmx.exe 22116 [ws@4413 threadName="vcpu-1"] SCSI DEVICE (scsi0:0): MODE SENSE(6) for unsupported page 0x8
2025-12-14T09:05:38.372Z -INFO vmware-vmx.exe 22116 [ws@4413 threadName="vcpu-1"] SCSI DEVICE (scsi0:0): MODE SENSE(6) for unsupported page 0x8
2025-12-14T09:05:38.421Z -INFO vmware-vmx.exe 22116 [ws@4413 threadName="vcpu-1"] SCSI DEVICE (scsi0:0): MODE SENSE(6) for unsupported page 0x8
2025-12-14T09:05:38.421Z -INFO vmware-vmx.exe 22116 [ws@4413 threadName="vcpu-1"] SCSI DEVICE (scsi0:0): MODE SENSE(6) for unsupported page 0x8
2025-12-14T09:05:38.422Z -INFO vmware-vmx.exe 22116 [ws@4413 threadName="vcpu-1"] SCSI DEVICE (scsi0:0): MODE SENSE(6) for unsupported page 0x8
2025-12-14T09:05:38.422Z -INFO vmware-vmx.exe 22116 [ws@4413 threadName="vcpu-1"] SCSI DEVICE (scsi0:0): MODE SENSE(6) for unsupported page 0x8
2025-12-14T09:05:38.424Z -INFO vmware-vmx.exe 22116 [ws@4413 threadName="vcpu-1"] SCSI DEVICE (scsi0:0): MODE SENSE(6) for unsupported page 0x8
2025-12-14T09:05:38.424Z -INFO vmware-vmx.exe 22116 [ws@4413 threadName="vcpu-1"] SCSI DEVICE (scsi0:0): MODE SENSE(6) for unsupported page 0x8
2025-12-14T09:05:38.579Z -INFO vmware-vmx.exe 22116 [ws@4413 threadName="vcpu-0"] SCSI DEVICE (scsi0:0): MODE SENSE(6) for unsupported page 0x8
2025-12-14T09:05:38.579Z -INFO vmware-vmx.exe 22116 [ws@4413 threadName="vcpu-0"] SCSI DEVICE (scsi0:0): MODE SENSE(6) for unsupported page 0x8
2025-12-14T09:05:38.581Z -INFO vmware-vmx.exe 22116 [ws@4413 threadName="vcpu-0"] SCSI DEVICE (scsi0:0): MODE SENSE(6) for unsupported page 0x8
2025-12-14T09:05:38.581Z -INFO vmware-vmx.exe 22116 [ws@4413 threadName="vcpu-0"] SCSI DEVICE (scsi0:0): MODE SENSE(6) for unsupported page 0x8
2025-12-14T09:05:38.582Z -INFO vmware-vmx.exe 22116 [ws@4413 threadName="vcpu-0"] SCSI DEVICE (scsi0:0): MODE SENSE(6) for unsupported page 0x8
2025-12-14T09:05:38.582Z -INFO vmware-vmx.exe 22116 [ws@4413 threadName="vcpu-0"] SCSI DEVICE (scsi0:0): MODE SENSE(6) for unsupported page 0x8
2025-12-14T09:05:38.700Z -INFO vmware-vmx.exe 22116 [ws@4413 threadName="vcpu-0"] DISKUTIL: scsi0:0 : capacity=83886080 logical sector size=512
2025-12-14T09:05:42.132Z -INFO vmware-vmx.exe 22116 [ws@4413 threadName="vcpu-1"] HgfsChannelVmciConnectInternal: VMCI HGFS server session init complete and opened.
2025-12-14T09:05:42.132Z -INFO vmware-vmx.exe 22116 [ws@4413 threadName="vcpu-1"] HgfsChannelVmciRecvMsgCB: VMCI HGFS server session started: header version: 2.
2025-12-14T09:05:42.133Z -INFO vmware-vmx.exe 22116 [ws@4413 threadName="hgfsWorkerThread"] VTHREAD 3368 "hgfsWorkerThread"
2025-12-14T09:05:42.133Z -INFO vmware-vmx.exe 22116 [ws@4413 threadName="hgfsWorkerThread"] VTHREAD 17008 "hgfsWorkerThread"
2025-12-14T09:05:42.133Z -INFO vmware-vmx.exe 22116 [ws@4413 threadName="hgfsWorkerThread"] VTHREAD 5728 "hgfsWorkerThread"
2025-12-14T09:05:42.133Z -INFO vmware-vmx.exe 22116 [ws@4413 threadName="hgfsWorkerThread"] VTHREAD 1528 "hgfsWorkerThread"
2025-12-14T09:05:42.134Z -INFO vmware-vmx.exe 22116 [ws@4413 threadName="hgfsWorkerThread"] VTHREAD 18864 "hgfsWorkerThread"
2025-12-14T09:05:42.134Z -INFO vmware-vmx.exe 22116 [ws@4413 threadName="hgfsWorkerThread"] VTHREAD 7568 "hgfsWorkerThread"
2025-12-14T09:05:42.134Z -INFO vmware-vmx.exe 22116 [ws@4413 threadName="hgfsWorkerThread"] VTHREAD 5732 "hgfsWorkerThread"
2025-12-14T09:05:42.134Z -INFO vmware-vmx.exe 22116 [ws@4413 threadName="hgfsWorkerThread"] VTHREAD 16840 "hgfsWorkerThread"
2025-12-14T09:05:42.134Z -INFO vmware-vmx.exe 22116 [ws@4413 threadName="hgfsWorkerThread"] VTHREAD 22120 "hgfsWorkerThread"
2025-12-14T09:05:42.134Z -INFO vmware-vmx.exe 22116 [ws@4413 threadName="hgfsWorkerThread"] VTHREAD 748 "hgfsWorkerThread"
2025-12-14T09:05:42.135Z -INFO vmware-vmx.exe 22116 [ws@4413 threadName="vcpu-1"] HgfsThreadpool_Activate: count of worker threads: 10.
2025-12-14T09:05:42.135Z -INFO vmware-vmx.exe 22116 [ws@4413 threadName="vcpu-1"] HgfsServerAllocateSession: init session 2203A895550 id 1078efbdd986
2025-12-14T09:05:54.258Z -INFO vmware-vmx.exe 22116 [ws@4413 threadName="vcpu-1"] SCSI DEVICE (scsi0:0): MODE SENSE(6) for unsupported page 0x8
2025-12-14T09:05:54.258Z -INFO vmware-vmx.exe 22116 [ws@4413 threadName="vcpu-1"] SCSI DEVICE (scsi0:0): MODE SENSE(6) for unsupported page 0x8
2025-12-14T09:05:54.260Z -INFO vmware-vmx.exe 22116 [ws@4413 threadName="vcpu-1"] SCSI DEVICE (scsi0:0): MODE SENSE(6) for unsupported page 0x8
2025-12-14T09:05:54.260Z -INFO vmware-vmx.exe 22116 [ws@4413 threadName="vcpu-1"] SCSI DEVICE (scsi0:0): MODE SENSE(6) for unsupported page 0x8
2025-12-14T09:05:54.262Z -INFO vmware-vmx.exe 22116 [ws@4413 threadName="vcpu-0"] SCSI DEVICE (scsi0:0): MODE SENSE(6) for unsupported page 0x8
2025-12-14T09:05:54.262Z -INFO vmware-vmx.exe 22116 [ws@4413 threadName="vcpu-0"] SCSI DEVICE (scsi0:0): MODE SENSE(6) for unsupported page 0x8
2025-12-14T09:05:54.264Z -INFO vmware-vmx.exe 22116 [ws@4413 threadName="vcpu-0"] SCSI DEVICE (scsi0:0): MODE SENSE(6) for unsupported page 0x8
2025-12-14T09:05:54.264Z -INFO vmware-vmx.exe 22116 [ws@4413 threadName="vcpu-0"] SCSI DEVICE (scsi0:0): MODE SENSE(6) for unsupported page 0x8
2025-12-14T09:05:54.266Z -INFO vmware-vmx.exe 22116 [ws@4413 threadName="vcpu-0"] SCSI DEVICE (scsi0:0): MODE SENSE(6) for unsupported page 0x8
2025-12-14T09:05:54.266Z -INFO vmware-vmx.exe 22116 [ws@4413 threadName="vcpu-0"] SCSI DEVICE (scsi0:0): MODE SENSE(6) for unsupported page 0x8
2025-12-14T09:05:54.267Z -INFO vmware-vmx.exe 22116 [ws@4413 threadName="vcpu-0"] SCSI DEVICE (scsi0:0): MODE SENSE(6) for unsupported page 0x8
2025-12-14T09:05:54.268Z -INFO vmware-vmx.exe 22116 [ws@4413 threadName="vcpu-0"] SCSI DEVICE (scsi0:0): MODE SENSE(6) for unsupported page 0x8
2025-12-14T09:05:58.046Z -INFO vmware-vmx.exe 22116 [ws@4413 threadName="vcpu-0"] SCSI DEVICE (scsi0:0): MODE SENSE(6) for unsupported page 0x8
2025-12-14T09:05:58.046Z -INFO vmware-vmx.exe 22116 [ws@4413 threadName="vcpu-0"] SCSI DEVICE (scsi0:0): MODE SENSE(6) for unsupported page 0x8
2025-12-14T09:05:58.048Z -INFO vmware-vmx.exe 22116 [ws@4413 threadName="vcpu-1"] SCSI DEVICE (scsi0:0): MODE SENSE(6) for unsupported page 0x8
2025-12-14T09:05:58.048Z -INFO vmware-vmx.exe 22116 [ws@4413 threadName="vcpu-1"] SCSI DEVICE (scsi0:0): MODE SENSE(6) for unsupported page 0x8
2025-12-14T09:05:58.050Z -INFO vmware-vmx.exe 22116 [ws@4413 threadName="vcpu-1"] SCSI DEVICE (scsi0:0): MODE SENSE(6) for unsupported page 0x8
2025-12-14T09:05:58.050Z -INFO vmware-vmx.exe 22116 [ws@4413 threadName="vcpu-1"] SCSI DEVICE (scsi0:0): MODE SENSE(6) for unsupported page 0x8
2025-12-14T09:05:58.052Z -INFO vmware-vmx.exe 22116 [ws@4413 threadName="vcpu-0"] SCSI DEVICE (scsi0:0): MODE SENSE(6) for unsupported page 0x8
2025-12-14T09:05:58.052Z -INFO vmware-vmx.exe 22116 [ws@4413 threadName="vcpu-0"] SCSI DEVICE (scsi0:0): MODE SENSE(6) for unsupported page 0x8
2025-12-14T09:05:58.054Z -INFO vmware-vmx.exe 22116 [ws@4413 threadName="vcpu-0"] SCSI DEVICE (scsi0:0): MODE SENSE(6) for unsupported page 0x8
2025-12-14T09:05:58.054Z -INFO vmware-vmx.exe 22116 [ws@4413 threadName="vcpu-1"] SCSI DEVICE (scsi0:0): MODE SENSE(6) for unsupported page 0x8
2025-12-14T09:05:58.055Z -INFO vmware-vmx.exe 22116 [ws@4413 threadName="vcpu-0"] SCSI DEVICE (scsi0:0): MODE SENSE(6) for unsupported page 0x8
2025-12-14T09:05:58.055Z -INFO vmware-vmx.exe 22116 [ws@4413 threadName="vcpu-0"] SCSI DEVICE (scsi0:0): MODE SENSE(6) for unsupported page 0x8
2025-12-14T09:05:58.134Z -INFO vmware-vmx.exe 22116 [ws@4413 threadName="vcpu-0"] CDROM: Emulate GET CONFIGURATION RT 2 starting feature 0
2025-12-14T09:05:58.134Z -INFO vmware-vmx.exe 22116 [ws@4413 threadName="vcpu-0"] CDROM: Emulate GET CONFIGURATION RT 2 starting feature 0
2025-12-14T09:05:58.136Z -INFO vmware-vmx.exe 22116 [ws@4413 threadName="vcpu-1"] CDROM: Emulate GET CONFIGURATION RT 2 starting feature 0
2025-12-14T09:05:58.136Z -INFO vmware-vmx.exe 22116 [ws@4413 threadName="vcpu-1"] CDROM: Emulate GET CONFIGURATION RT 2 starting feature 0
2025-12-14T09:05:58.136Z -INFO vmware-vmx.exe 22116 [ws@4413 threadName="vcpu-1"] CDROM: Emulate GET CONFIGURATION RT 2 starting feature 45
2025-12-14T09:05:58.137Z -INFO vmware-vmx.exe 22116 [ws@4413 threadName="vcpu-1"] CDROM: Emulate GET CONFIGURATION RT 2 starting feature 45
2025-12-14T09:05:58.137Z -INFO vmware-vmx.exe 22116 [ws@4413 threadName="vcpu-1"] CDROM: Emulate GET CONFIGURATION RT 2 starting feature 47
2025-12-14T09:05:58.137Z -INFO vmware-vmx.exe 22116 [ws@4413 threadName="vcpu-1"] CDROM: Emulate GET CONFIGURATION RT 2 starting feature 47
2025-12-14T09:05:58.137Z -INFO vmware-vmx.exe 22116 [ws@4413 threadName="vcpu-1"] CDROM: Emulate GET CONFIGURATION RT 2 starting feature 43
2025-12-14T09:05:58.137Z -INFO vmware-vmx.exe 22116 [ws@4413 threadName="vcpu-1"] CDROM: Emulate GET CONFIGURATION RT 2 starting feature 43
2025-12-14T09:05:58.137Z -INFO vmware-vmx.exe 22116 [ws@4413 threadName="vcpu-1"] CDROM: Emulate GET CONFIGURATION RT 2 starting feature 42
2025-12-14T09:05:58.137Z -INFO vmware-vmx.exe 22116 [ws@4413 threadName="vcpu-1"] CDROM: Emulate GET CONFIGURATION RT 2 starting feature 42
2025-12-14T09:05:58.137Z -INFO vmware-vmx.exe 22116 [ws@4413 threadName="vcpu-1"] CDROM: Emulate GET CONFIGURATION RT 2 starting feature 59
2025-12-14T09:05:58.138Z -INFO vmware-vmx.exe 22116 [ws@4413 threadName="vcpu-1"] CDROM: Emulate GET CONFIGURATION RT 2 starting feature 59
2025-12-14T09:05:58.138Z -INFO vmware-vmx.exe 22116 [ws@4413 threadName="vcpu-1"] CDROM: Emulate GET CONFIGURATION RT 2 starting feature 65
2025-12-14T09:05:58.138Z -INFO vmware-vmx.exe 22116 [ws@4413 threadName="vcpu-1"] CDROM: Emulate GET CONFIGURATION RT 2 starting feature 65
2025-12-14T09:05:58.138Z -INFO vmware-vmx.exe 22116 [ws@4413 threadName="vcpu-1"] CDROM: Emulate GET CONFIGURATION RT 2 starting feature 0
2025-12-14T09:05:58.138Z -INFO vmware-vmx.exe 22116 [ws@4413 threadName="vcpu-1"] CDROM: Emulate GET CONFIGURATION RT 2 starting feature 0
2025-12-14T09:05:58.143Z -INFO vmware-vmx.exe 22116 [ws@4413 threadName="vcpu-0"] CDROM: Emulate GET CONFIGURATION RT 2 starting feature 0
2025-12-14T09:05:58.143Z -INFO vmware-vmx.exe 22116 [ws@4413 threadName="vcpu-0"] CDROM: Emulate GET CONFIGURATION RT 2 starting feature 0
2025-12-14T09:05:58.143Z -INFO vmware-vmx.exe 22116 [ws@4413 threadName="vcpu-0"] CDROM: Emulate GET CONFIGURATION RT 2 starting feature 45
2025-12-14T09:05:58.143Z -INFO vmware-vmx.exe 22116 [ws@4413 threadName="vcpu-0"] CDROM: Emulate GET CONFIGURATION RT 2 starting feature 45
2025-12-14T09:05:58.143Z -INFO vmware-vmx.exe 22116 [ws@4413 threadName="vcpu-0"] CDROM: Emulate GET CONFIGURATION RT 2 starting feature 47
2025-12-14T09:05:58.143Z -INFO vmware-vmx.exe 22116 [ws@4413 threadName="vcpu-0"] CDROM: Emulate GET CONFIGURATION RT 2 starting feature 47
2025-12-14T09:05:58.145Z -INFO vmware-vmx.exe 22116 [ws@4413 threadName="vcpu-0"] CDROM: Emulate GET CONFIGURATION RT 2 starting feature 43
2025-12-14T09:05:58.145Z -INFO vmware-vmx.exe 22116 [ws@4413 threadName="vcpu-0"] CDROM: Emulate GET CONFIGURATION RT 2 starting feature 43
2025-12-14T09:05:58.145Z -INFO vmware-vmx.exe 22116 [ws@4413 threadName="vcpu-0"] CDROM: Emulate GET CONFIGURATION RT 2 starting feature 42
2025-12-14T09:05:58.145Z -INFO vmware-vmx.exe 22116 [ws@4413 threadName="vcpu-0"] CDROM: Emulate GET CONFIGURATION RT 2 starting feature 42
2025-12-14T09:05:58.145Z -INFO vmware-vmx.exe 22116 [ws@4413 threadName="vcpu-0"] CDROM: Emulate GET CONFIGURATION RT 2 starting feature 59
2025-12-14T09:05:58.145Z -INFO vmware-vmx.exe 22116 [ws@4413 threadName="vcpu-0"] CDROM: Emulate GET CONFIGURATION RT 2 starting feature 59
2025-12-14T09:05:58.145Z -INFO vmware-vmx.exe 22116 [ws@4413 threadName="vcpu-0"] CDROM: Emulate GET CONFIGURATION RT 2 starting feature 65
2025-12-14T09:05:58.145Z -INFO vmware-vmx.exe 22116 [ws@4413 threadName="vcpu-0"] CDROM: Emulate GET CONFIGURATION RT 2 starting feature 65
2025-12-14T09:05:58.145Z -INFO vmware-vmx.exe 22116 [ws@4413 threadName="vcpu-0"] CDROM: Emulate GET CONFIGURATION RT 2 starting feature 0
2025-12-14T09:05:58.145Z -INFO vmware-vmx.exe 22116 [ws@4413 threadName="vcpu-0"] CDROM: Emulate GET CONFIGURATION RT 2 starting feature 0
2025-12-14T09:05:59.038Z -INFO vmware-vmx.exe 22116 [ws@4413 threadName="vcpu-0"] DISKUTIL: scsi0:0 : capacity=83886080 logical sector size=512
2025-12-14T09:05:59.487Z -INFO vmware-vmx.exe 22116 [ws@4413 threadName="vcpu-1"] DISKUTIL: scsi0:0 : capacity=83886080 logical sector size=512
2025-12-14T09:06:00.399Z -INFO vmware-vmx.exe 22116 [ws@4413 threadName="vcpu-0"] DISKUTIL: scsi0:0 : capacity=83886080 logical sector size=512
2025-12-14T09:06:00.699Z -INFO vmware-vmx.exe 22116 [ws@4413 threadName="vcpu-1"] DISKUTIL: scsi0:0 : capacity=83886080 logical sector size=512
2025-12-14T09:06:01.215Z -INFO vmware-vmx.exe 22116 [ws@4413 threadName="vmx"] DISKLIB-LIB : numIOs = 50000 numMergedIOs = 24691 numSplitIOs = 1368
2025-12-14T09:06:06.711Z -INFO vmware-vmx.exe 22116 [ws@4413 threadName="vmx"] GuestInfo: HostinfoDetailedDataHeader version: 1
2025-12-14T09:06:06.711Z -NOTICE vmware-vmx.exe 22116 [ws@4413 threadName="vmx"] ConfigDB: Setting guestInfo.detailed.data = <not printed>
2025-12-14T09:06:10.658Z -INFO vmware-vmx.exe 22116 [ws@4413 threadName="vmx"] GuestRpc: Got RPCI vsocket connection 10, assigned to channel 1.
2025-12-14T09:06:20.774Z -INFO vmware-vmx.exe 22116 [ws@4413 threadName="vmx"] Guest: toolbox-dnd: Version: 13.0.1.0 (build-24843032)
2025-12-14T09:06:20.775Z -WARNING vmware-vmx.exe 22116 [ws@4413 threadName="vcpu-1"] GuestRpc: application toolbox-dnd, changing channel 65535 -> 1
2025-12-14T09:06:20.775Z -INFO vmware-vmx.exe 22116 [ws@4413 threadName="vcpu-1"] GuestRpc: Channel 1, guest application toolbox-dnd.
2025-12-14T09:06:20.775Z -INFO vmware-vmx.exe 22116 [ws@4413 threadName="vcpu-1"] TOOLS: appName=toolbox-dnd, oldStatus=0, status=1, guestInitiated=0.
2025-12-14T09:06:20.779Z -INFO vmware-vmx.exe 22116 [ws@4413 threadName="vmx"] DnDCP: dndGuestVersion from vmdb failed, setting to 4
2025-12-14T09:06:20.779Z -INFO vmware-vmx.exe 22116 [ws@4413 threadName="vmx"] DnDCP: set guest controllers to version 4
2025-12-14T09:06:20.782Z -INFO vmware-vmx.exe 22116 [ws@4413 threadName="vmx"] DnDCP: set guest controllers to version 4
2025-12-14T09:06:20.782Z -INFO vmware-vmx.exe 22116 [ws@4413 threadName="vmx"] DnDCP: set guest controllers to version 4
2025-12-14T09:06:21.085Z -INFO vmware-vmx.exe 22116 [ws@4413 threadName="vmx"] DnDCP: set guest controllers to version 4
2025-12-14T09:06:26.335Z -INFO vmware-vmx.exe 22116 [ws@4413 threadName="vcpu-0"] SOUNDLIB: Creating WAVE backend stream.
2025-12-14T09:06:26.367Z -INFO vmware-vmx.exe 22116 [ws@4413 threadName="vcpu-0"] SOUNDLIB: SoundWaveSelectHostDevice: Found device Speaker (Synaptics HD Audio)
2025-12-14T09:06:26.367Z -INFO vmware-vmx.exe 22116 [ws@4413 threadName="vcpu-0"] SOUNDLIB: SoundWaveSelectHostDevice: Found device U32G3X (NVIDIA High Definition
2025-12-14T09:06:26.367Z -INFO vmware-vmx.exe 22116 [ws@4413 threadName="vcpu-0"] SOUNDLIB: SoundWaveSelectHostDevice: Found device Headset Earphone (Logitech Mono
2025-12-14T09:06:26.390Z -INFO vmware-vmx.exe 22116 [ws@4413 threadName="vcpu-0"] SOUNDLIB: SoundWaveComputeBufferParams: Initializing 10 buffers of length 3840, capable of holding a total of 200000 usecs of sound.
2025-12-14T09:06:26.391Z -INFO vmware-vmx.exe 22116 [ws@4413 threadName="soundWavePlayback0"] VTHREAD 3056 "soundWavePlayback0"
2025-12-14T09:06:26.391Z -INFO vmware-vmx.exe 22116 [ws@4413 threadName="soundWavePlayback0"] SOUNDLIB: SoundWaveThread: Poll thread entered : id(3056)
2025-12-14T09:06:26.391Z -INFO vmware-vmx.exe 22116 [ws@4413 threadName="vcpu-0"] SOUNDLIB: SoundWaveCreateStream: Created poll thread : id(3056)
2025-12-14T09:06:26.402Z -INFO vmware-vmx.exe 22116 [ws@4413 threadName="vcpu-0"] SOUNDLIB: Starting WAVE stream 220013842A0.
2025-12-14T09:06:28.343Z -INFO vmware-vmx.exe 22116 [ws@4413 threadName="vcpu-0"] SOUNDLIB: Stopping WAVE stream 220013842A0.
2025-12-14T09:06:28.353Z -INFO vmware-vmx.exe 22116 [ws@4413 threadName="soundWavePlayback0"] SOUNDLIB: SoundWavePoll: Poll invoked on a non-running stream; leaving early.
2025-12-14T09:06:28.354Z -INFO vmware-vmx.exe 22116 [ws@4413 threadName="vcpu-0"] SOUNDLIB: Closing WAVE stream 220013842A0.
2025-12-14T09:06:28.354Z -INFO vmware-vmx.exe 22116 [ws@4413 threadName="vcpu-0"] SOUNDLIB: SoundWaveCloseStream: Destroying poll thread : id(3056)
2025-12-14T09:06:28.354Z -INFO vmware-vmx.exe 22116 [ws@4413 threadName="soundWavePlayback0"] SOUNDLIB: SoundWaveThread: Poll thread exited : id(3056)
2025-12-14T09:07:37.252Z -INFO vmware-vmx.exe 22116 [ws@4413 threadName="vcpu-0"] DISKUTIL: scsi0:0 : capacity=83886080 logical sector size=512
2025-12-14T09:09:39.090Z -INFO vmware-vmx.exe 22116 [ws@4413 threadName="vcpu-1"] SOUNDLIB: Creating WAVE backend stream.
2025-12-14T09:09:39.093Z -INFO vmware-vmx.exe 22116 [ws@4413 threadName="vcpu-1"] SOUNDLIB: SoundWaveSelectHostDevice: Found device Speaker (Synaptics HD Audio)
2025-12-14T09:09:39.093Z -INFO vmware-vmx.exe 22116 [ws@4413 threadName="vcpu-1"] SOUNDLIB: SoundWaveSelectHostDevice: Found device U32G3X (NVIDIA High Definition
2025-12-14T09:09:39.093Z -INFO vmware-vmx.exe 22116 [ws@4413 threadName="vcpu-1"] SOUNDLIB: SoundWaveSelectHostDevice: Found device Headset Earphone (Logitech Mono
2025-12-14T09:09:39.115Z -INFO vmware-vmx.exe 22116 [ws@4413 threadName="vcpu-1"] SOUNDLIB: SoundWaveComputeBufferParams: Initializing 10 buffers of length 3840, capable of holding a total of 200000 usecs of sound.
2025-12-14T09:09:39.116Z -INFO vmware-vmx.exe 22116 [ws@4413 threadName="soundWavePlayback1"] VTHREAD 7456 "soundWavePlayback1"
2025-12-14T09:09:39.116Z -INFO vmware-vmx.exe 22116 [ws@4413 threadName="soundWavePlayback1"] SOUNDLIB: SoundWaveThread: Poll thread entered : id(7456)
2025-12-14T09:09:39.116Z -INFO vmware-vmx.exe 22116 [ws@4413 threadName="vcpu-1"] SOUNDLIB: SoundWaveCreateStream: Created poll thread : id(7456)
2025-12-14T09:09:39.126Z -INFO vmware-vmx.exe 22116 [ws@4413 threadName="vcpu-0"] SOUNDLIB: Starting WAVE stream 220013842A0.
2025-12-14T09:09:41.615Z -INFO vmware-vmx.exe 22116 [ws@4413 threadName="vmx"] SOUNDLIB: Stopping WAVE stream 220013842A0.
2025-12-14T09:09:41.626Z -INFO vmware-vmx.exe 22116 [ws@4413 threadName="soundWavePlayback1"] SOUNDLIB: SoundWavePoll: Poll invoked on a non-running stream; leaving early.
2025-12-14T09:09:41.627Z -INFO vmware-vmx.exe 22116 [ws@4413 threadName="vmx"] SOUNDLIB: Closing WAVE stream 220013842A0.
2025-12-14T09:09:41.627Z -INFO vmware-vmx.exe 22116 [ws@4413 threadName="vmx"] SOUNDLIB: SoundWaveCloseStream: Destroying poll thread : id(7456)
2025-12-14T09:09:41.627Z -INFO vmware-vmx.exe 22116 [ws@4413 threadName="soundWavePlayback1"] SOUNDLIB: SoundWaveThread: Poll thread exited : id(7456)
2025-12-14T09:12:15.183Z -INFO vmware-vmx.exe 22116 [ws@4413 threadName="vmx"] CPClipboard_SetItem: Set CPClipboard struct with data of size:414088, format:1.
2025-12-14T09:13:34.540Z -INFO vmware-vmx.exe 22116 [ws@4413 threadName="vcpu-0"] DISKUTIL: scsi0:0 : capacity=83886080 logical sector size=512
2025-12-14T09:13:34.541Z -INFO vmware-vmx.exe 22116 [ws@4413 threadName="vcpu-0"] DISKUTIL: scsi0:0 : capacity=83886080 logical sector size=512
2025-12-14T09:13:47.243Z -INFO vmware-vmx.exe 22116 [ws@4413 threadName="vcpu-0"] SOUNDLIB: Creating WAVE backend stream.
2025-12-14T09:13:47.246Z -INFO vmware-vmx.exe 22116 [ws@4413 threadName="vcpu-0"] SOUNDLIB: SoundWaveSelectHostDevice: Found device Speaker (Synaptics HD Audio)
2025-12-14T09:13:47.246Z -INFO vmware-vmx.exe 22116 [ws@4413 threadName="vcpu-0"] SOUNDLIB: SoundWaveSelectHostDevice: Found device U32G3X (NVIDIA High Definition
2025-12-14T09:13:47.246Z -INFO vmware-vmx.exe 22116 [ws@4413 threadName="vcpu-0"] SOUNDLIB: SoundWaveSelectHostDevice: Found device Headset Earphone (Logitech Mono
2025-12-14T09:13:47.268Z -INFO vmware-vmx.exe 22116 [ws@4413 threadName="vcpu-0"] SOUNDLIB: SoundWaveComputeBufferParams: Initializing 10 buffers of length 3840, capable of holding a total of 200000 usecs of sound.
2025-12-14T09:13:47.268Z -INFO vmware-vmx.exe 22116 [ws@4413 threadName="soundWavePlayback2"] VTHREAD 7684 "soundWavePlayback2"
2025-12-14T09:13:47.268Z -INFO vmware-vmx.exe 22116 [ws@4413 threadName="soundWavePlayback2"] SOUNDLIB: SoundWaveThread: Poll thread entered : id(7684)
2025-12-14T09:13:47.268Z -INFO vmware-vmx.exe 22116 [ws@4413 threadName="vcpu-0"] SOUNDLIB: SoundWaveCreateStream: Created poll thread : id(7684)
2025-12-14T09:13:47.280Z -INFO vmware-vmx.exe 22116 [ws@4413 threadName="vcpu-0"] SOUNDLIB: Starting WAVE stream 22008D8BBF0.
2025-12-14T09:13:49.773Z -INFO vmware-vmx.exe 22116 [ws@4413 threadName="vmx"] SOUNDLIB: Stopping WAVE stream 22008D8BBF0.
2025-12-14T09:13:49.784Z -INFO vmware-vmx.exe 22116 [ws@4413 threadName="soundWavePlayback2"] SOUNDLIB: SoundWavePoll: Poll invoked on a non-running stream; leaving early.
2025-12-14T09:13:49.785Z -INFO vmware-vmx.exe 22116 [ws@4413 threadName="vmx"] SOUNDLIB: Closing WAVE stream 22008D8BBF0.
2025-12-14T09:13:49.785Z -INFO vmware-vmx.exe 22116 [ws@4413 threadName="vmx"] SOUNDLIB: SoundWaveCloseStream: Destroying poll thread : id(7684)
2025-12-14T09:13:49.785Z -INFO vmware-vmx.exe 22116 [ws@4413 threadName="soundWavePlayback2"] SOUNDLIB: SoundWaveThread: Poll thread exited : id(7684)
2025-12-14T09:15:52.772Z -INFO vmware-vmx.exe 22116 [ws@4413 threadName="vcpu-1"] DISKUTIL: scsi0:0 : capacity=83886080 logical sector size=512
2025-12-14T09:16:02.320Z -INFO vmware-vmx.exe 22116 [ws@4413 threadName="vcpu-1"] SOUNDLIB: Creating WAVE backend stream.
2025-12-14T09:16:02.323Z -INFO vmware-vmx.exe 22116 [ws@4413 threadName="vcpu-1"] SOUNDLIB: SoundWaveSelectHostDevice: Found device Speaker (Synaptics HD Audio)
2025-12-14T09:16:02.323Z -INFO vmware-vmx.exe 22116 [ws@4413 threadName="vcpu-1"] SOUNDLIB: SoundWaveSelectHostDevice: Found device U32G3X (NVIDIA High Definition
2025-12-14T09:16:02.323Z -INFO vmware-vmx.exe 22116 [ws@4413 threadName="vcpu-1"] SOUNDLIB: SoundWaveSelectHostDevice: Found device Headset Earphone (Logitech Mono
2025-12-14T09:16:02.344Z -INFO vmware-vmx.exe 22116 [ws@4413 threadName="vcpu-1"] SOUNDLIB: SoundWaveComputeBufferParams: Initializing 10 buffers of length 3840, capable of holding a total of 200000 usecs of sound.
2025-12-14T09:16:02.345Z -INFO vmware-vmx.exe 22116 [ws@4413 threadName="soundWavePlayback3"] VTHREAD 13508 "soundWavePlayback3"
2025-12-14T09:16:02.345Z -INFO vmware-vmx.exe 22116 [ws@4413 threadName="soundWavePlayback3"] SOUNDLIB: SoundWaveThread: Poll thread entered : id(13508)
2025-12-14T09:16:02.345Z -INFO vmware-vmx.exe 22116 [ws@4413 threadName="vcpu-1"] SOUNDLIB: SoundWaveCreateStream: Created poll thread : id(13508)
2025-12-14T09:16:02.354Z -INFO vmware-vmx.exe 22116 [ws@4413 threadName="vcpu-0"] SOUNDLIB: Starting WAVE stream 22008F79AC0.
2025-12-14T09:16:03.705Z -INFO vmware-vmx.exe 22116 [ws@4413 threadName="vcpu-0"] SCSI scsi0:0: Unsupported command LOG SENSE issued. --ok
2025-12-14T09:16:04.833Z -INFO vmware-vmx.exe 22116 [ws@4413 threadName="vmx"] SOUNDLIB: Stopping WAVE stream 22008F79AC0.
2025-12-14T09:16:04.844Z -INFO vmware-vmx.exe 22116 [ws@4413 threadName="soundWavePlayback3"] SOUNDLIB: SoundWavePoll: Poll invoked on a non-running stream; leaving early.
2025-12-14T09:16:04.844Z -INFO vmware-vmx.exe 22116 [ws@4413 threadName="vmx"] SOUNDLIB: Closing WAVE stream 22008F79AC0.
2025-12-14T09:16:04.844Z -INFO vmware-vmx.exe 22116 [ws@4413 threadName="vmx"] SOUNDLIB: SoundWaveCloseStream: Destroying poll thread : id(13508)
2025-12-14T09:16:04.844Z -INFO vmware-vmx.exe 22116 [ws@4413 threadName="soundWavePlayback3"] SOUNDLIB: SoundWaveThread: Poll thread exited : id(13508)
2025-12-14T09:16:51.804Z -INFO vmware-vmx.exe 22116 [ws@4413 threadName="vcpu-0"] SOUNDLIB: Creating WAVE backend stream.
2025-12-14T09:16:51.806Z -INFO vmware-vmx.exe 22116 [ws@4413 threadName="vcpu-0"] SOUNDLIB: SoundWaveSelectHostDevice: Found device Speaker (Synaptics HD Audio)
2025-12-14T09:16:51.806Z -INFO vmware-vmx.exe 22116 [ws@4413 threadName="vcpu-0"] SOUNDLIB: SoundWaveSelectHostDevice: Found device U32G3X (NVIDIA High Definition
2025-12-14T09:16:51.806Z -INFO vmware-vmx.exe 22116 [ws@4413 threadName="vcpu-0"] SOUNDLIB: SoundWaveSelectHostDevice: Found device Headset Earphone (Logitech Mono
2025-12-14T09:16:51.827Z -INFO vmware-vmx.exe 22116 [ws@4413 threadName="vcpu-0"] SOUNDLIB: SoundWaveComputeBufferParams: Initializing 10 buffers of length 3840, capable of holding a total of 200000 usecs of sound.
2025-12-14T09:16:51.827Z -INFO vmware-vmx.exe 22116 [ws@4413 threadName="soundWavePlayback4"] VTHREAD 20092 "soundWavePlayback4"
2025-12-14T09:16:51.827Z -INFO vmware-vmx.exe 22116 [ws@4413 threadName="soundWavePlayback4"] SOUNDLIB: SoundWaveThread: Poll thread entered : id(20092)
2025-12-14T09:16:51.828Z -INFO vmware-vmx.exe 22116 [ws@4413 threadName="vcpu-0"] SOUNDLIB: SoundWaveCreateStream: Created poll thread : id(20092)
2025-12-14T09:16:51.837Z -INFO vmware-vmx.exe 22116 [ws@4413 threadName="vcpu-0"] SOUNDLIB: Starting WAVE stream 22008FBEAC0.
2025-12-14T09:16:52.433Z -INFO vmware-vmx.exe 22116 [ws@4413 threadName="vcpu-0"] DISKUTIL: scsi0:0 : capacity=83886080 logical sector size=512
2025-12-14T09:16:53.057Z -INFO vmware-vmx.exe 22116 [ws@4413 threadName="vcpu-1"] DISKUTIL: scsi0:0 : capacity=83886080 logical sector size=512
2025-12-14T09:16:54.334Z -INFO vmware-vmx.exe 22116 [ws@4413 threadName="vmx"] SOUNDLIB: Stopping WAVE stream 22008FBEAC0.
2025-12-14T09:16:54.345Z -INFO vmware-vmx.exe 22116 [ws@4413 threadName="soundWavePlayback4"] SOUNDLIB: SoundWavePoll: Poll invoked on a non-running stream; leaving early.
2025-12-14T09:16:54.347Z -INFO vmware-vmx.exe 22116 [ws@4413 threadName="vmx"] SOUNDLIB: Closing WAVE stream 22008FBEAC0.
2025-12-14T09:16:54.347Z -INFO vmware-vmx.exe 22116 [ws@4413 threadName="vmx"] SOUNDLIB: SoundWaveCloseStream: Destroying poll thread : id(20092)
2025-12-14T09:16:54.347Z -INFO vmware-vmx.exe 22116 [ws@4413 threadName="soundWavePlayback4"] SOUNDLIB: SoundWaveThread: Poll thread exited : id(20092)
2025-12-14T09:16:59.546Z -INFO vmware-vmx.exe 22116 [ws@4413 threadName="vcpu-1"] SOUNDLIB: Creating WAVE backend stream.
2025-12-14T09:16:59.548Z -INFO vmware-vmx.exe 22116 [ws@4413 threadName="vcpu-1"] SOUNDLIB: SoundWaveSelectHostDevice: Found device Speaker (Synaptics HD Audio)
2025-12-14T09:16:59.548Z -INFO vmware-vmx.exe 22116 [ws@4413 threadName="vcpu-1"] SOUNDLIB: SoundWaveSelectHostDevice: Found device U32G3X (NVIDIA High Definition
2025-12-14T09:16:59.548Z -INFO vmware-vmx.exe 22116 [ws@4413 threadName="vcpu-1"] SOUNDLIB: SoundWaveSelectHostDevice: Found device Headset Earphone (Logitech Mono
2025-12-14T09:16:59.569Z -INFO vmware-vmx.exe 22116 [ws@4413 threadName="vcpu-1"] SOUNDLIB: SoundWaveComputeBufferParams: Initializing 10 buffers of length 3840, capable of holding a total of 200000 usecs of sound.
2025-12-14T09:16:59.569Z -INFO vmware-vmx.exe 22116 [ws@4413 threadName="soundWavePlayback5"] VTHREAD 21276 "soundWavePlayback5"
2025-12-14T09:16:59.569Z -INFO vmware-vmx.exe 22116 [ws@4413 threadName="soundWavePlayback5"] SOUNDLIB: SoundWaveThread: Poll thread entered : id(21276)
2025-12-14T09:16:59.570Z -INFO vmware-vmx.exe 22116 [ws@4413 threadName="vcpu-1"] SOUNDLIB: SoundWaveCreateStream: Created poll thread : id(21276)
2025-12-14T09:16:59.580Z -INFO vmware-vmx.exe 22116 [ws@4413 threadName="vcpu-0"] SOUNDLIB: Starting WAVE stream 22008FBEFC0.
2025-12-14T09:17:02.080Z -INFO vmware-vmx.exe 22116 [ws@4413 threadName="vmx"] SOUNDLIB: Stopping WAVE stream 22008FBEFC0.
2025-12-14T09:17:02.092Z -INFO vmware-vmx.exe 22116 [ws@4413 threadName="soundWavePlayback5"] SOUNDLIB: SoundWavePoll: Poll invoked on a non-running stream; leaving early.
2025-12-14T09:17:02.093Z -INFO vmware-vmx.exe 22116 [ws@4413 threadName="vmx"] SOUNDLIB: Closing WAVE stream 22008FBEFC0.
2025-12-14T09:17:02.093Z -INFO vmware-vmx.exe 22116 [ws@4413 threadName="vmx"] SOUNDLIB: SoundWaveCloseStream: Destroying poll thread : id(21276)
2025-12-14T09:17:02.093Z -INFO vmware-vmx.exe 22116 [ws@4413 threadName="soundWavePlayback5"] SOUNDLIB: SoundWaveThread: Poll thread exited : id(21276)
2025-12-14T09:17:03.716Z -INFO vmware-vmx.exe 22116 [ws@4413 threadName="vcpu-1"] Guest: DXUM_09: 9780: Unsupported caps requested. (type=45)
2025-12-14T09:17:03.716Z -INFO vmware-vmx.exe 22116 [ws@4413 threadName="vcpu-1"] Guest: DXUM_09: 9780: Unsupported caps requested. (type=46)
2025-12-14T09:17:03.724Z -INFO vmware-vmx.exe 22116 [ws@4413 threadName="vcpu-1"] Guest: DXUM_09: 9780: Unrecognized shader, use fallback path.
2025-12-14T09:17:03.724Z -INFO vmware-vmx.exe 22116 [ws@4413 threadName="vcpu-1"] Guest: DXUM_09: 9780: Unrecognized shader, use fallback path.
2025-12-14T09:17:03.724Z -INFO vmware-vmx.exe 22116 [ws@4413 threadName="vcpu-1"] Guest: DXUM_09: 9780: Unrecognized shader, use fallback path.
2025-12-14T09:20:37.977Z -INFO vmware-vmx.exe 22116 [ws@4413 threadName="vcpu-1"] DISKUTIL: scsi0:0 : capacity=83886080 logical sector size=512
2025-12-14T09:20:44.199Z -INFO vmware-vmx.exe 22116 [ws@4413 threadName="vcpu-0"] DISKUTIL: scsi0:0 : capacity=83886080 logical sector size=512
2025-12-14T09:20:48.085Z -INFO vmware-vmx.exe 22116 [ws@4413 threadName="vcpu-0"] SOUNDLIB: Creating WAVE backend stream.
2025-12-14T09:20:48.088Z -INFO vmware-vmx.exe 22116 [ws@4413 threadName="vcpu-0"] SOUNDLIB: SoundWaveSelectHostDevice: Found device Speaker (Synaptics HD Audio)
2025-12-14T09:20:48.088Z -INFO vmware-vmx.exe 22116 [ws@4413 threadName="vcpu-0"] SOUNDLIB: SoundWaveSelectHostDevice: Found device U32G3X (NVIDIA High Definition
2025-12-14T09:20:48.088Z -INFO vmware-vmx.exe 22116 [ws@4413 threadName="vcpu-0"] SOUNDLIB: SoundWaveSelectHostDevice: Found device Headset Earphone (Logitech Mono
2025-12-14T09:20:48.110Z -INFO vmware-vmx.exe 22116 [ws@4413 threadName="vcpu-0"] SOUNDLIB: SoundWaveComputeBufferParams: Initializing 10 buffers of length 3840, capable of holding a total of 200000 usecs of sound.
2025-12-14T09:20:48.111Z -INFO vmware-vmx.exe 22116 [ws@4413 threadName="soundWavePlayback6"] VTHREAD 13204 "soundWavePlayback6"
2025-12-14T09:20:48.111Z -INFO vmware-vmx.exe 22116 [ws@4413 threadName="soundWavePlayback6"] SOUNDLIB: SoundWaveThread: Poll thread entered : id(13204)
2025-12-14T09:20:48.111Z -INFO vmware-vmx.exe 22116 [ws@4413 threadName="vcpu-0"] SOUNDLIB: SoundWaveCreateStream: Created poll thread : id(13204)
2025-12-14T09:20:48.122Z -INFO vmware-vmx.exe 22116 [ws@4413 threadName="vcpu-0"] SOUNDLIB: Starting WAVE stream 22008F98770.
2025-12-14T09:20:49.776Z -INFO vmware-vmx.exe 22116 [ws@4413 threadName="vmx"] SOUNDLIB: Stopping WAVE stream 22008F98770.
2025-12-14T09:20:49.787Z -INFO vmware-vmx.exe 22116 [ws@4413 threadName="soundWavePlayback6"] SOUNDLIB: SoundWavePoll: Poll invoked on a non-running stream; leaving early.
2025-12-14T09:20:49.788Z -INFO vmware-vmx.exe 22116 [ws@4413 threadName="vmx"] SOUNDLIB: Closing WAVE stream 22008F98770.
2025-12-14T09:20:49.788Z -INFO vmware-vmx.exe 22116 [ws@4413 threadName="vmx"] SOUNDLIB: SoundWaveCloseStream: Destroying poll thread : id(13204)
2025-12-14T09:20:49.788Z -INFO vmware-vmx.exe 22116 [ws@4413 threadName="soundWavePlayback6"] SOUNDLIB: SoundWaveThread: Poll thread exited : id(13204)
2025-12-14T09:26:02.585Z -INFO vmware-vmx.exe 22116 [ws@4413 threadName="vmx"] DISKLIB-LIB : numIOs = 100000 numMergedIOs = 35909 numSplitIOs = 2349
2025-12-14T09:26:42.772Z -INFO vmware-vmx.exe 22116 [ws@4413 threadName="vcpu-1"] SCSI DEVICE (scsi0:0): MODE SENSE(6) for unsupported page 0x8
2025-12-14T09:26:42.772Z -INFO vmware-vmx.exe 22116 [ws@4413 threadName="vcpu-0"] SCSI DEVICE (scsi0:0): MODE SENSE(6) for unsupported page 0x8
2025-12-14T09:26:42.774Z -INFO vmware-vmx.exe 22116 [ws@4413 threadName="vcpu-1"] SCSI DEVICE (scsi0:0): MODE SENSE(6) for unsupported page 0x8
2025-12-14T09:26:42.774Z -INFO vmware-vmx.exe 22116 [ws@4413 threadName="vcpu-1"] SCSI DEVICE (scsi0:0): MODE SENSE(6) for unsupported page 0x8
2025-12-14T09:26:42.776Z -INFO vmware-vmx.exe 22116 [ws@4413 threadName="vcpu-1"] SCSI DEVICE (scsi0:0): MODE SENSE(6) for unsupported page 0x8
2025-12-14T09:26:42.776Z -INFO vmware-vmx.exe 22116 [ws@4413 threadName="vcpu-1"] SCSI DEVICE (scsi0:0): MODE SENSE(6) for unsupported page 0x8
2025-12-14T09:26:42.778Z -INFO vmware-vmx.exe 22116 [ws@4413 threadName="vcpu-1"] SCSI DEVICE (scsi0:0): MODE SENSE(6) for unsupported page 0x8
2025-12-14T09:26:42.778Z -INFO vmware-vmx.exe 22116 [ws@4413 threadName="vcpu-1"] SCSI DEVICE (scsi0:0): MODE SENSE(6) for unsupported page 0x8
2025-12-14T09:26:42.780Z -INFO vmware-vmx.exe 22116 [ws@4413 threadName="vcpu-1"] SCSI DEVICE (scsi0:0): MODE SENSE(6) for unsupported page 0x8
2025-12-14T09:26:42.780Z -INFO vmware-vmx.exe 22116 [ws@4413 threadName="vcpu-0"] SCSI DEVICE (scsi0:0): MODE SENSE(6) for unsupported page 0x8
2025-12-14T09:26:42.782Z -INFO vmware-vmx.exe 22116 [ws@4413 threadName="vcpu-1"] SCSI DEVICE (scsi0:0): MODE SENSE(6) for unsupported page 0x8
2025-12-14T09:26:42.782Z -INFO vmware-vmx.exe 22116 [ws@4413 threadName="vcpu-1"] SCSI DEVICE (scsi0:0): MODE SENSE(6) for unsupported page 0x8
2025-12-14T09:26:52.541Z -INFO vmware-vmx.exe 22116 [ws@4413 threadName="vcpu-0"] DISKUTIL: scsi0:0 : capacity=83886080 logical sector size=512
2025-12-14T09:29:07.100Z -INFO vmware-vmx.exe 22116 [ws@4413 threadName="vmx"] DISKLIB-LIB : numIOs = 150000 numMergedIOs = 45199 numSplitIOs = 3692
2025-12-14T09:33:32.242Z -INFO vmware-vmx.exe 22116 [ws@4413 threadName="vmx"] CPClipboard_SetItem: Set CPClipboard struct with data of size:107625, format:6.
2025-12-14T09:34:59.585Z -INFO vmware-vmx.exe 22116 [ws@4413 threadName="vmx"] MemSched: caller 0 numvm 1 locked pages: num 1572923 max 7264512
2025-12-14T09:34:59.585Z -INFO vmware-vmx.exe 22116 [ws@4413 threadName="vmx"] MemSched: locked Page Limit: host 7589303 config 7272704
2025-12-14T09:34:59.585Z -INFO vmware-vmx.exe 22116 [ws@4413 threadName="vmx"] MemSched: minmempct 50 timestamp 7410
2025-12-14T09:34:59.585Z -INFO vmware-vmx.exe 22116 [ws@4413 threadName="vmx"] MemSched: VM 0 min 799432 max 1585864 shares 1572864 paged 1330494 nonpaged 5264 anonymous 7736 locked 1572923 touchedPct 23 dirtiedPct 6 timestamp 7410 vmResponsive is 1
2025-12-14T09:34:59.585Z -INFO vmware-vmx.exe 22116 [ws@4413 threadName="vmx"] MemSched: locked 1572923 target 1585864 balloon 0 0 1022361 swapped 8783 0 allocd 2 512 state 0 100
2025-12-14T09:34:59.585Z -INFO vmware-vmx.exe 22116 [ws@4413 threadName="vmx"] MemSched: states: 0 1801 : 1 0 : 2 0 : 3 0
2025-12-14T09:34:59.585Z -INFO vmware-vmx.exe 22116 [ws@4413 threadName="vmx"] MemSched: Balloon enabled 1 guestType 4 maxSize 0
2025-12-14T09:35:31.224Z -INFO vmware-vmx.exe 22116 [ws@4413 threadName="vmx"] CPClipboard_SetItem: Set CPClipboard struct with data of size:120, format:1.
2025-12-14T09:37:11.122Z -INFO vmware-vmx.exe 22116 [ws@4413 threadName="vmx"] CPClipboard_SetItem: Set CPClipboard struct with data of size:97, format:1.
2025-12-14T09:47:31.273Z -INFO vmware-vmx.exe 22116 [ws@4413 threadName="vcpu-1"] CDROM: Emulate GET CONFIGURATION RT 2 starting feature 0
2025-12-14T09:47:31.273Z -INFO vmware-vmx.exe 22116 [ws@4413 threadName="vcpu-1"] CDROM: Emulate GET CONFIGURATION RT 2 starting feature 0
2025-12-14T09:47:31.273Z -INFO vmware-vmx.exe 22116 [ws@4413 threadName="vcpu-1"] CDROM: Emulate GET CONFIGURATION RT 2 starting feature 45
2025-12-14T09:47:31.273Z -INFO vmware-vmx.exe 22116 [ws@4413 threadName="vcpu-1"] CDROM: Emulate GET CONFIGURATION RT 2 starting feature 45
2025-12-14T09:47:31.273Z -INFO vmware-vmx.exe 22116 [ws@4413 threadName="vcpu-0"] CDROM: Emulate GET CONFIGURATION RT 2 starting feature 47
2025-12-14T09:47:31.273Z -INFO vmware-vmx.exe 22116 [ws@4413 threadName="vcpu-0"] CDROM: Emulate GET CONFIGURATION RT 2 starting feature 47
2025-12-14T09:47:31.273Z -INFO vmware-vmx.exe 22116 [ws@4413 threadName="vcpu-0"] CDROM: Emulate GET CONFIGURATION RT 2 starting feature 43
2025-12-14T09:47:31.273Z -INFO vmware-vmx.exe 22116 [ws@4413 threadName="vcpu-0"] CDROM: Emulate GET CONFIGURATION RT 2 starting feature 43
2025-12-14T09:47:31.274Z -INFO vmware-vmx.exe 22116 [ws@4413 threadName="vcpu-0"] CDROM: Emulate GET CONFIGURATION RT 2 starting feature 42
2025-12-14T09:47:31.274Z -INFO vmware-vmx.exe 22116 [ws@4413 threadName="vcpu-0"] CDROM: Emulate GET CONFIGURATION RT 2 starting feature 42
2025-12-14T09:47:31.274Z -INFO vmware-vmx.exe 22116 [ws@4413 threadName="vcpu-0"] CDROM: Emulate GET CONFIGURATION RT 2 starting feature 59
2025-12-14T09:47:31.274Z -INFO vmware-vmx.exe 22116 [ws@4413 threadName="vcpu-0"] CDROM: Emulate GET CONFIGURATION RT 2 starting feature 59
2025-12-14T09:47:31.274Z -INFO vmware-vmx.exe 22116 [ws@4413 threadName="vcpu-0"] CDROM: Emulate GET CONFIGURATION RT 2 starting feature 65
2025-12-14T09:47:31.274Z -INFO vmware-vmx.exe 22116 [ws@4413 threadName="vcpu-1"] CDROM: Emulate GET CONFIGURATION RT 2 starting feature 65
2025-12-14T09:47:31.274Z -INFO vmware-vmx.exe 22116 [ws@4413 threadName="vcpu-1"] CDROM: Emulate GET CONFIGURATION RT 2 starting feature 0
2025-12-14T09:47:31.275Z -INFO vmware-vmx.exe 22116 [ws@4413 threadName="vcpu-1"] CDROM: Emulate GET CONFIGURATION RT 2 starting feature 0
2025-12-14T09:47:31.276Z -INFO vmware-vmx.exe 22116 [ws@4413 threadName="vcpu-0"] CDROM: Emulate GET CONFIGURATION RT 0 starting feature 0
2025-12-14T09:47:31.276Z -INFO vmware-vmx.exe 22116 [ws@4413 threadName="vcpu-0"] CDROM: Emulate GET CONFIGURATION RT 0 starting feature 0
2025-12-14T09:49:53.432Z -INFO vmware-vmx.exe 22116 [ws@4413 threadName="vmx"] DISKLIB-LIB : numIOs = 200000 numMergedIOs = 65507 numSplitIOs = 8234
2025-12-14T09:50:29.811Z -INFO vmware-vmx.exe 22116 [ws@4413 threadName="vmx"] CPClipboard_SetItem: Set CPClipboard struct with data of size:113, format:1.
2025-12-14T09:51:50.168Z -INFO vmware-vmx.exe 22116 [ws@4413 threadName="vmx"] CPClipboard_SetItem: Set CPClipboard struct with data of size:116, format:1.
2025-12-14T09:53:12.960Z -INFO vmware-vmx.exe 22116 [ws@4413 threadName="vmx"] CPClipboard_SetItem: Set CPClipboard struct with data of size:69, format:1.
2025-12-14T09:53:12.960Z -INFO vmware-vmx.exe 22116 [ws@4413 threadName="vmx"] CPClipboard_SetItem: Set CPClipboard struct with data of size:41758, format:3.
2025-12-14T09:56:35.808Z -INFO vmware-vmx.exe 22116 [ws@4413 threadName="vmx"] CPClipboard_SetItem: Set CPClipboard struct with data of size:187, format:1.
2025-12-14T09:56:35.808Z -INFO vmware-vmx.exe 22116 [ws@4413 threadName="vmx"] CPClipboard_SetItem: Set CPClipboard struct with data of size:42588, format:3.
2025-12-14T09:57:52.153Z -INFO vmware-vmx.exe 22116 [ws@4413 threadName="vmx"] CPClipboard_SetItem: Set CPClipboard struct with data of size:289495, format:6.
2025-12-14T10:01:12.019Z -INFO vmware-vmx.exe 22116 [ws@4413 threadName="vcpu-1"] SOUNDLIB: Creating WAVE backend stream.
2025-12-14T10:01:12.022Z -INFO vmware-vmx.exe 22116 [ws@4413 threadName="vcpu-1"] SOUNDLIB: SoundWaveSelectHostDevice: Found device Speaker (Synaptics HD Audio)
2025-12-14T10:01:12.022Z -INFO vmware-vmx.exe 22116 [ws@4413 threadName="vcpu-1"] SOUNDLIB: SoundWaveSelectHostDevice: Found device U32G3X (NVIDIA High Definition
2025-12-14T10:01:12.022Z -INFO vmware-vmx.exe 22116 [ws@4413 threadName="vcpu-1"] SOUNDLIB: SoundWaveSelectHostDevice: Found device Headset Earphone (Logitech Mono
2025-12-14T10:01:12.090Z -INFO vmware-vmx.exe 22116 [ws@4413 threadName="vcpu-1"] SOUNDLIB: SoundWaveComputeBufferParams: Initializing 10 buffers of length 3840, capable of holding a total of 200000 usecs of sound.
2025-12-14T10:01:12.091Z -INFO vmware-vmx.exe 22116 [ws@4413 threadName="soundWavePlayback7"] VTHREAD 21040 "soundWavePlayback7"
2025-12-14T10:01:12.091Z -INFO vmware-vmx.exe 22116 [ws@4413 threadName="soundWavePlayback7"] SOUNDLIB: SoundWaveThread: Poll thread entered : id(21040)
2025-12-14T10:01:12.091Z -INFO vmware-vmx.exe 22116 [ws@4413 threadName="vcpu-1"] SOUNDLIB: SoundWaveCreateStream: Created poll thread : id(21040)
2025-12-14T10:01:12.102Z -INFO vmware-vmx.exe 22116 [ws@4413 threadName="vcpu-0"] SOUNDLIB: Starting WAVE stream 2200889B860.
2025-12-14T10:01:13.718Z -INFO vmware-vmx.exe 22116 [ws@4413 threadName="vmx"] SOUNDLIB: Stopping WAVE stream 2200889B860.
2025-12-14T10:01:13.728Z -INFO vmware-vmx.exe 22116 [ws@4413 threadName="soundWavePlayback7"] SOUNDLIB: SoundWavePoll: Poll invoked on a non-running stream; leaving early.
2025-12-14T10:01:13.729Z -INFO vmware-vmx.exe 22116 [ws@4413 threadName="vmx"] SOUNDLIB: Closing WAVE stream 2200889B860.
2025-12-14T10:01:13.729Z -INFO vmware-vmx.exe 22116 [ws@4413 threadName="vmx"] SOUNDLIB: SoundWaveCloseStream: Destroying poll thread : id(21040)
2025-12-14T10:01:13.729Z -INFO vmware-vmx.exe 22116 [ws@4413 threadName="soundWavePlayback7"] SOUNDLIB: SoundWaveThread: Poll thread exited : id(21040)
2025-12-14T10:03:01.366Z -INFO vmware-vmx.exe 22116 [ws@4413 threadName="vcpu-1"] SCSI DEVICE (scsi0:0): MODE SENSE(6) for unsupported page 0x8
2025-12-14T10:03:01.366Z -INFO vmware-vmx.exe 22116 [ws@4413 threadName="vcpu-1"] SCSI DEVICE (scsi0:0): MODE SENSE(6) for unsupported page 0x8
2025-12-14T10:03:01.368Z -INFO vmware-vmx.exe 22116 [ws@4413 threadName="vcpu-0"] SCSI DEVICE (scsi0:0): MODE SENSE(6) for unsupported page 0x8
2025-12-14T10:03:01.368Z -INFO vmware-vmx.exe 22116 [ws@4413 threadName="vcpu-0"] SCSI DEVICE (scsi0:0): MODE SENSE(6) for unsupported page 0x8
2025-12-14T10:03:01.370Z -INFO vmware-vmx.exe 22116 [ws@4413 threadName="vcpu-1"] SCSI DEVICE (scsi0:0): MODE SENSE(6) for unsupported page 0x8
2025-12-14T10:03:01.370Z -INFO vmware-vmx.exe 22116 [ws@4413 threadName="vcpu-1"] SCSI DEVICE (scsi0:0): MODE SENSE(6) for unsupported page 0x8
2025-12-14T10:03:01.372Z -INFO vmware-vmx.exe 22116 [ws@4413 threadName="vcpu-1"] SCSI DEVICE (scsi0:0): MODE SENSE(6) for unsupported page 0x8
2025-12-14T10:03:01.372Z -INFO vmware-vmx.exe 22116 [ws@4413 threadName="vcpu-1"] SCSI DEVICE (scsi0:0): MODE SENSE(6) for unsupported page 0x8
2025-12-14T10:03:01.374Z -INFO vmware-vmx.exe 22116 [ws@4413 threadName="vcpu-1"] SCSI DEVICE (scsi0:0): MODE SENSE(6) for unsupported page 0x8
2025-12-14T10:03:01.374Z -INFO vmware-vmx.exe 22116 [ws@4413 threadName="vcpu-0"] SCSI DEVICE (scsi0:0): MODE SENSE(6) for unsupported page 0x8
2025-12-14T10:03:01.376Z -INFO vmware-vmx.exe 22116 [ws@4413 threadName="vcpu-1"] SCSI DEVICE (scsi0:0): MODE SENSE(6) for unsupported page 0x8
2025-12-14T10:03:01.376Z -INFO vmware-vmx.exe 22116 [ws@4413 threadName="vcpu-1"] SCSI DEVICE (scsi0:0): MODE SENSE(6) for unsupported page 0x8
2025-12-14T10:03:06.013Z -INFO vmware-vmx.exe 22116 [ws@4413 threadName="vcpu-1"] SOUNDLIB: Creating WAVE backend stream.
2025-12-14T10:03:06.016Z -INFO vmware-vmx.exe 22116 [ws@4413 threadName="vcpu-1"] SOUNDLIB: SoundWaveSelectHostDevice: Found device Speaker (Synaptics HD Audio)
2025-12-14T10:03:06.016Z -INFO vmware-vmx.exe 22116 [ws@4413 threadName="vcpu-1"] SOUNDLIB: SoundWaveSelectHostDevice: Found device U32G3X (NVIDIA High Definition
2025-12-14T10:03:06.016Z -INFO vmware-vmx.exe 22116 [ws@4413 threadName="vcpu-1"] SOUNDLIB: SoundWaveSelectHostDevice: Found device Headset Earphone (Logitech Mono
2025-12-14T10:03:06.038Z -INFO vmware-vmx.exe 22116 [ws@4413 threadName="vcpu-1"] SOUNDLIB: SoundWaveComputeBufferParams: Initializing 10 buffers of length 3840, capable of holding a total of 200000 usecs of sound.
2025-12-14T10:03:06.038Z -INFO vmware-vmx.exe 22116 [ws@4413 threadName="soundWavePlayback8"] VTHREAD 1928 "soundWavePlayback8"
2025-12-14T10:03:06.038Z -INFO vmware-vmx.exe 22116 [ws@4413 threadName="soundWavePlayback8"] SOUNDLIB: SoundWaveThread: Poll thread entered : id(1928)
2025-12-14T10:03:06.038Z -INFO vmware-vmx.exe 22116 [ws@4413 threadName="vcpu-1"] SOUNDLIB: SoundWaveCreateStream: Created poll thread : id(1928)
2025-12-14T10:03:06.048Z -INFO vmware-vmx.exe 22116 [ws@4413 threadName="vcpu-0"] SOUNDLIB: Starting WAVE stream 2200889B220.
2025-12-14T10:03:07.718Z -INFO vmware-vmx.exe 22116 [ws@4413 threadName="vmx"] SOUNDLIB: Stopping WAVE stream 2200889B220.
2025-12-14T10:03:07.729Z -INFO vmware-vmx.exe 22116 [ws@4413 threadName="soundWavePlayback8"] SOUNDLIB: SoundWavePoll: Poll invoked on a non-running stream; leaving early.
2025-12-14T10:03:07.730Z -INFO vmware-vmx.exe 22116 [ws@4413 threadName="vmx"] SOUNDLIB: Closing WAVE stream 2200889B220.
2025-12-14T10:03:07.730Z -INFO vmware-vmx.exe 22116 [ws@4413 threadName="vmx"] SOUNDLIB: SoundWaveCloseStream: Destroying poll thread : id(1928)
2025-12-14T10:03:07.730Z -INFO vmware-vmx.exe 22116 [ws@4413 threadName="soundWavePlayback8"] SOUNDLIB: SoundWaveThread: Poll thread exited : id(1928)
2025-12-14T10:04:24.947Z -INFO vmware-vmx.exe 22116 [ws@4413 threadName="vcpu-1"] SOUNDLIB: Creating WAVE backend stream.
2025-12-14T10:04:24.949Z -INFO vmware-vmx.exe 22116 [ws@4413 threadName="vcpu-1"] SOUNDLIB: SoundWaveSelectHostDevice: Found device Speaker (Synaptics HD Audio)
2025-12-14T10:04:24.949Z -INFO vmware-vmx.exe 22116 [ws@4413 threadName="vcpu-1"] SOUNDLIB: SoundWaveSelectHostDevice: Found device U32G3X (NVIDIA High Definition
2025-12-14T10:04:24.949Z -INFO vmware-vmx.exe 22116 [ws@4413 threadName="vcpu-1"] SOUNDLIB: SoundWaveSelectHostDevice: Found device Headset Earphone (Logitech Mono
2025-12-14T10:04:24.971Z -INFO vmware-vmx.exe 22116 [ws@4413 threadName="vcpu-1"] SOUNDLIB: SoundWaveComputeBufferParams: Initializing 10 buffers of length 3840, capable of holding a total of 200000 usecs of sound.
2025-12-14T10:04:24.972Z -INFO vmware-vmx.exe 22116 [ws@4413 threadName="soundWavePlayback9"] VTHREAD 9672 "soundWavePlayback9"
2025-12-14T10:04:24.972Z -INFO vmware-vmx.exe 22116 [ws@4413 threadName="soundWavePlayback9"] SOUNDLIB: SoundWaveThread: Poll thread entered : id(9672)
2025-12-14T10:04:24.972Z -INFO vmware-vmx.exe 22116 [ws@4413 threadName="vcpu-1"] SOUNDLIB: SoundWaveCreateStream: Created poll thread : id(9672)
2025-12-14T10:04:24.982Z -INFO vmware-vmx.exe 22116 [ws@4413 threadName="vcpu-0"] SOUNDLIB: Starting WAVE stream 2200889C3A0.
2025-12-14T10:04:26.640Z -INFO vmware-vmx.exe 22116 [ws@4413 threadName="vmx"] SOUNDLIB: Stopping WAVE stream 2200889C3A0.
2025-12-14T10:04:26.651Z -INFO vmware-vmx.exe 22116 [ws@4413 threadName="soundWavePlayback9"] SOUNDLIB: SoundWavePoll: Poll invoked on a non-running stream; leaving early.
2025-12-14T10:04:26.651Z -INFO vmware-vmx.exe 22116 [ws@4413 threadName="vmx"] SOUNDLIB: Closing WAVE stream 2200889C3A0.
2025-12-14T10:04:26.651Z -INFO vmware-vmx.exe 22116 [ws@4413 threadName="vmx"] SOUNDLIB: SoundWaveCloseStream: Destroying poll thread : id(9672)
2025-12-14T10:04:26.651Z -INFO vmware-vmx.exe 22116 [ws@4413 threadName="soundWavePlayback9"] SOUNDLIB: SoundWaveThread: Poll thread exited : id(9672)
2025-12-14T10:05:00.022Z -INFO vmware-vmx.exe 22116 [ws@4413 threadName="vmx"] MemSched: caller 0 numvm 1 locked pages: num 1557358 max 7264512
2025-12-14T10:05:00.022Z -INFO vmware-vmx.exe 22116 [ws@4413 threadName="vmx"] MemSched: locked Page Limit: host 7603955 config 7272704
2025-12-14T10:05:00.022Z -INFO vmware-vmx.exe 22116 [ws@4413 threadName="vmx"] MemSched: minmempct 50 timestamp 9211
2025-12-14T10:05:00.022Z -INFO vmware-vmx.exe 22116 [ws@4413 threadName="vmx"] MemSched: VM 0 min 799432 max 1585864 shares 1572864 paged 1330494 nonpaged 5264 anonymous 7736 locked 1557358 touchedPct 16 dirtiedPct 4 timestamp 9211 vmResponsive is 1
2025-12-14T10:05:00.022Z -INFO vmware-vmx.exe 22116 [ws@4413 threadName="vmx"] MemSched: locked 1557358 target 1585864 balloon 0 0 1022361 swapped 24341 0 allocd 0 512 state 0 100
2025-12-14T10:05:00.022Z -INFO vmware-vmx.exe 22116 [ws@4413 threadName="vmx"] MemSched: states: 0 3601 : 1 0 : 2 0 : 3 0
2025-12-14T10:05:00.022Z -INFO vmware-vmx.exe 22116 [ws@4413 threadName="vmx"] MemSched: Balloon enabled 1 guestType 4 maxSize 0
2025-12-14T10:15:00.239Z -INFO vmware-vmx.exe 22116 [ws@4413 threadName="vcpu-0"] SOUNDLIB: Creating WAVE backend stream.
2025-12-14T10:15:00.242Z -INFO vmware-vmx.exe 22116 [ws@4413 threadName="vcpu-0"] SOUNDLIB: SoundWaveSelectHostDevice: Found device Speaker (Synaptics HD Audio)
2025-12-14T10:15:00.242Z -INFO vmware-vmx.exe 22116 [ws@4413 threadName="vcpu-0"] SOUNDLIB: SoundWaveSelectHostDevice: Found device U32G3X (NVIDIA High Definition
2025-12-14T10:15:00.242Z -INFO vmware-vmx.exe 22116 [ws@4413 threadName="vcpu-0"] SOUNDLIB: SoundWaveSelectHostDevice: Found device Headset Earphone (Logitech Mono
2025-12-14T10:15:00.242Z -WARNING vmware-vmx.exe 22116 [ws@4413 threadName="vcpu-0"] SOUNDLIB: SoundWaveOpenHostDevice: Unable to open Wave device ID 2
2025-12-14T10:15:00.242Z -WARNING vmware-vmx.exe 22116 [ws@4413 threadName="vcpu-0"] SOUNDLIB: SoundWaveLogWaveError: A device ID has been used that is out of range for your system.
2025-12-14T10:15:00.243Z -WARNING vmware-vmx.exe 22116 [ws@4413 threadName="vcpu-0"] SOUNDLIB: SoundWaveCreateStream: Unable to open host device.
2025-12-14T10:15:00.243Z -INFO vmware-vmx.exe 22116 [ws@4413 threadName="vcpu-0"] SOUNDLIB: SoundLib_CreateSyncSoundStream: Failed to create sound stream.
2025-12-14T10:15:00.243Z -INFO vmware-vmx.exe 22116 [ws@4413 threadName="vcpu-0"] SOUNDLIB: SoundMuxCreateSoundStream: Failed to create underlying sound stream.
2025-12-14T10:15:00.243Z -INFO vmware-vmx.exe 22116 [ws@4413 threadName="vcpu-0"] SOUNDLIB: SoundLib_CreateSyncSoundStream: Failed to create sound stream.
2025-12-14T10:15:00.243Z -WARNING vmware-vmx.exe 22116 [ws@4413 threadName="vcpu-0"] HDAudio: HDAudioCreateBackendStream: Error creating stream 0, type:wave.
2025-12-14T10:15:00.243Z -INFO vmware-vmx.exe 22116 [ws@4413 threadName="vcpu-0"] Msg_Post: Warning
2025-12-14T10:15:00.243Z -INFO vmware-vmx.exe 22116 [ws@4413 threadName="vcpu-0"] [msg.sound.stream.error.create.generic] Error in creating sound stream.
2025-12-14T10:15:00.243Z -INFO vmware-vmx.exe 22116 [ws@4413 threadName="vcpu-0"] [msg.sound.stream.error.recording] Recording might not work.
2025-12-14T10:15:00.243Z -INFO vmware-vmx.exe 22116 [ws@4413 threadName="vcpu-0"] ----------------------------------------
2025-12-14T10:15:00.340Z -INFO vmware-vmx.exe 22116 [ws@4413 threadName="vcpu-1"] SOUNDLIB: Creating WAVE backend stream.
2025-12-14T10:15:00.342Z -INFO vmware-vmx.exe 22116 [ws@4413 threadName="vcpu-1"] SOUNDLIB: SoundWaveSelectHostDevice: Found device Speaker (Synaptics HD Audio)
2025-12-14T10:15:00.342Z -INFO vmware-vmx.exe 22116 [ws@4413 threadName="vcpu-1"] SOUNDLIB: SoundWaveSelectHostDevice: Found device U32G3X (NVIDIA High Definition
2025-12-14T10:15:00.342Z -INFO vmware-vmx.exe 22116 [ws@4413 threadName="vcpu-1"] SOUNDLIB: SoundWaveSelectHostDevice: Found device Headset Earphone (Logitech Mono
2025-12-14T10:15:00.398Z -INFO vmware-vmx.exe 22116 [ws@4413 threadName="vcpu-1"] SOUNDLIB: SoundWaveComputeBufferParams: Initializing 10 buffers of length 3840, capable of holding a total of 200000 usecs of sound.
2025-12-14T10:15:00.399Z -INFO vmware-vmx.exe 22116 [ws@4413 threadName="soundWavePlayback10"] VTHREAD 7700 "soundWavePlayback10"
2025-12-14T10:15:00.399Z -INFO vmware-vmx.exe 22116 [ws@4413 threadName="soundWavePlayback10"] SOUNDLIB: SoundWaveThread: Poll thread entered : id(7700)
2025-12-14T10:15:00.399Z -INFO vmware-vmx.exe 22116 [ws@4413 threadName="vcpu-1"] SOUNDLIB: SoundWaveCreateStream: Created poll thread : id(7700)
2025-12-14T10:15:00.399Z -INFO vmware-vmx.exe 22116 [ws@4413 threadName="vcpu-0"] SOUNDLIB: Starting WAVE stream 2200889B220.
2025-12-14T10:15:15.919Z -INFO vmware-vmx.exe 22116 [ws@4413 threadName="vmx"] SOUNDLIB: Stopping WAVE stream 2200889B220.
2025-12-14T10:15:15.930Z -INFO vmware-vmx.exe 22116 [ws@4413 threadName="soundWavePlayback10"] SOUNDLIB: SoundWavePoll: Poll invoked on a non-running stream; leaving early.
2025-12-14T10:15:15.931Z -INFO vmware-vmx.exe 22116 [ws@4413 threadName="vmx"] SOUNDLIB: Closing WAVE stream 2200889B220.
2025-12-14T10:15:15.931Z -INFO vmware-vmx.exe 22116 [ws@4413 threadName="vmx"] SOUNDLIB: SoundWaveCloseStream: Destroying poll thread : id(7700)
2025-12-14T10:15:15.931Z -INFO vmware-vmx.exe 22116 [ws@4413 threadName="soundWavePlayback10"] SOUNDLIB: SoundWaveThread: Poll thread exited : id(7700)
2025-12-14T10:15:20.034Z -INFO vmware-vmx.exe 22116 [ws@4413 threadName="vcpu-1"] SOUNDLIB: Creating WAVE backend stream.
2025-12-14T10:15:20.036Z -INFO vmware-vmx.exe 22116 [ws@4413 threadName="vcpu-1"] SOUNDLIB: SoundWaveSelectHostDevice: Found device Headset Earphone (Logitech Mono
2025-12-14T10:15:20.060Z -INFO vmware-vmx.exe 22116 [ws@4413 threadName="vcpu-1"] SOUNDLIB: SoundWaveComputeBufferParams: Initializing 9 buffers of length 3584, capable of holding a total of 182857 usecs of sound.
2025-12-14T10:15:20.060Z -INFO vmware-vmx.exe 22116 [ws@4413 threadName="soundWaveRecord0"] VTHREAD 20288 "soundWaveRecord0"
2025-12-14T10:15:20.060Z -INFO vmware-vmx.exe 22116 [ws@4413 threadName="soundWaveRecord0"] SOUNDLIB: SoundWaveThread: Poll thread entered : id(20288)
2025-12-14T10:15:20.060Z -INFO vmware-vmx.exe 22116 [ws@4413 threadName="vcpu-1"] SOUNDLIB: SoundWaveCreateStream: Created poll thread : id(20288)
2025-12-14T10:15:20.060Z -INFO vmware-vmx.exe 22116 [ws@4413 threadName="vcpu-1"] SOUNDLIB: Starting WAVE stream 2200889CB20.
2025-12-14T10:15:20.153Z -INFO vmware-vmx.exe 22116 [ws@4413 threadName="vcpu-0"] SOUNDLIB: Creating WAVE backend stream.
2025-12-14T10:15:20.155Z -INFO vmware-vmx.exe 22116 [ws@4413 threadName="vcpu-0"] SOUNDLIB: SoundWaveSelectHostDevice: Found device Headset Earphone (Logitech Mono
2025-12-14T10:15:20.170Z -INFO vmware-vmx.exe 22116 [ws@4413 threadName="vcpu-0"] SOUNDLIB: SoundWaveComputeBufferParams: Initializing 10 buffers of length 3840, capable of holding a total of 200000 usecs of sound.
2025-12-14T10:15:20.170Z -INFO vmware-vmx.exe 22116 [ws@4413 threadName="soundWavePlayback11"] VTHREAD 8184 "soundWavePlayback11"
2025-12-14T10:15:20.170Z -INFO vmware-vmx.exe 22116 [ws@4413 threadName="soundWavePlayback11"] SOUNDLIB: SoundWaveThread: Poll thread entered : id(8184)
2025-12-14T10:15:20.170Z -INFO vmware-vmx.exe 22116 [ws@4413 threadName="vcpu-0"] SOUNDLIB: SoundWaveCreateStream: Created poll thread : id(8184)
2025-12-14T10:15:20.174Z -INFO vmware-vmx.exe 22116 [ws@4413 threadName="vcpu-0"] SOUNDLIB: Starting WAVE stream 2200889CC60.
2025-12-14T10:15:32.578Z -INFO vmware-vmx.exe 22116 [ws@4413 threadName="vcpu-0"] SOUNDLIB: Stopping WAVE stream 2200889CB20.
2025-12-14T10:15:32.585Z -INFO vmware-vmx.exe 22116 [ws@4413 threadName="soundWaveRecord0"] SOUNDLIB: SoundWavePoll: Poll invoked on a non-running stream; leaving early.
2025-12-14T10:15:32.586Z -INFO vmware-vmx.exe 22116 [ws@4413 threadName="vcpu-0"] SOUNDLIB: Closing WAVE stream 2200889CB20.
2025-12-14T10:15:32.586Z -INFO vmware-vmx.exe 22116 [ws@4413 threadName="vcpu-0"] SOUNDLIB: SoundWaveCloseStream: Destroying poll thread : id(20288)
2025-12-14T10:15:32.586Z -INFO vmware-vmx.exe 22116 [ws@4413 threadName="soundWaveRecord0"] SOUNDLIB: SoundWaveThread: Poll thread exited : id(20288)
2025-12-14T10:15:33.067Z -INFO vmware-vmx.exe 22116 [ws@4413 threadName="vmx"] SOUNDLIB: Stopping WAVE stream 2200889CC60.
2025-12-14T10:15:33.078Z -INFO vmware-vmx.exe 22116 [ws@4413 threadName="soundWavePlayback11"] SOUNDLIB: SoundWavePoll: Poll invoked on a non-running stream; leaving early.
2025-12-14T10:15:33.079Z -INFO vmware-vmx.exe 22116 [ws@4413 threadName="vmx"] SOUNDLIB: Closing WAVE stream 2200889CC60.
2025-12-14T10:15:33.079Z -INFO vmware-vmx.exe 22116 [ws@4413 threadName="vmx"] SOUNDLIB: SoundWaveCloseStream: Destroying poll thread : id(8184)
2025-12-14T10:15:33.079Z -INFO vmware-vmx.exe 22116 [ws@4413 threadName="soundWavePlayback11"] SOUNDLIB: SoundWaveThread: Poll thread exited : id(8184)
2025-12-14T10:24:53.875Z -INFO vmware-vmx.exe 22116 [ws@4413 threadName="vcpu-0"] SCSI DEVICE (scsi0:0): MODE SENSE(6) for unsupported page 0x8
2025-12-14T10:24:53.875Z -INFO vmware-vmx.exe 22116 [ws@4413 threadName="vcpu-0"] SCSI DEVICE (scsi0:0): MODE SENSE(6) for unsupported page 0x8
2025-12-14T10:24:53.877Z -INFO vmware-vmx.exe 22116 [ws@4413 threadName="vcpu-1"] SCSI DEVICE (scsi0:0): MODE SENSE(6) for unsupported page 0x8
2025-12-14T10:24:53.877Z -INFO vmware-vmx.exe 22116 [ws@4413 threadName="vcpu-1"] SCSI DEVICE (scsi0:0): MODE SENSE(6) for unsupported page 0x8
2025-12-14T10:24:53.879Z -INFO vmware-vmx.exe 22116 [ws@4413 threadName="vcpu-0"] SCSI DEVICE (scsi0:0): MODE SENSE(6) for unsupported page 0x8
2025-12-14T10:24:53.879Z -INFO vmware-vmx.exe 22116 [ws@4413 threadName="vcpu-0"] SCSI DEVICE (scsi0:0): MODE SENSE(6) for unsupported page 0x8
2025-12-14T10:24:53.881Z -INFO vmware-vmx.exe 22116 [ws@4413 threadName="vcpu-1"] SCSI DEVICE (scsi0:0): MODE SENSE(6) for unsupported page 0x8
2025-12-14T10:24:53.881Z -INFO vmware-vmx.exe 22116 [ws@4413 threadName="vcpu-1"] SCSI DEVICE (scsi0:0): MODE SENSE(6) for unsupported page 0x8
2025-12-14T10:24:53.883Z -INFO vmware-vmx.exe 22116 [ws@4413 threadName="vcpu-0"] SCSI DEVICE (scsi0:0): MODE SENSE(6) for unsupported page 0x8
2025-12-14T10:24:53.883Z -INFO vmware-vmx.exe 22116 [ws@4413 threadName="vcpu-0"] SCSI DEVICE (scsi0:0): MODE SENSE(6) for unsupported page 0x8
2025-12-14T10:24:53.885Z -INFO vmware-vmx.exe 22116 [ws@4413 threadName="vcpu-1"] SCSI DEVICE (scsi0:0): MODE SENSE(6) for unsupported page 0x8
2025-12-14T10:24:53.885Z -INFO vmware-vmx.exe 22116 [ws@4413 threadName="vcpu-1"] SCSI DEVICE (scsi0:0): MODE SENSE(6) for unsupported page 0x8
2025-12-14T10:35:00.716Z -INFO vmware-vmx.exe 22116 [ws@4413 threadName="vmx"] MemSched: caller 0 numvm 1 locked pages: num 1536585 max 7264512
2025-12-14T10:35:00.716Z -INFO vmware-vmx.exe 22116 [ws@4413 threadName="vmx"] MemSched: locked Page Limit: host 7568846 config 7272704
2025-12-14T10:35:00.716Z -INFO vmware-vmx.exe 22116 [ws@4413 threadName="vmx"] MemSched: minmempct 50 timestamp 11011
2025-12-14T10:35:00.716Z -INFO vmware-vmx.exe 22116 [ws@4413 threadName="vmx"] MemSched: VM 0 min 799432 max 1585864 shares 1572864 paged 1330494 nonpaged 5264 anonymous 7736 locked 1536585 touchedPct 15 dirtiedPct 5 timestamp 11011 vmResponsive is 1
2025-12-14T10:35:00.716Z -INFO vmware-vmx.exe 22116 [ws@4413 threadName="vmx"] MemSched: locked 1536585 target 1585864 balloon 0 0 1022361 swapped 45134 0 allocd 4 512 state 0 100
2025-12-14T10:35:00.716Z -INFO vmware-vmx.exe 22116 [ws@4413 threadName="vmx"] MemSched: states: 0 5401 : 1 0 : 2 0 : 3 0
2025-12-14T10:35:00.716Z -INFO vmware-vmx.exe 22116 [ws@4413 threadName="vmx"] MemSched: Balloon enabled 1 guestType 4 maxSize 0
2025-12-14T10:40:58.809Z -INFO vmware-vmx.exe 22116 [ws@4413 threadName="vmx"] CPClipboard_SetItem: Set CPClipboard struct with data of size:384716, format:6.
2025-12-14T10:43:25.728Z -INFO vmware-vmx.exe 22116 [ws@4413 threadName="vmx"] CPClipboard_SetItem: Set CPClipboard struct with data of size:1799, format:1.
2025-12-14T10:44:29.888Z -INFO vmware-vmx.exe 22116 [ws@4413 threadName="vmx"] CPClipboard_SetItem: Set CPClipboard struct with data of size:1799, format:1.
2025-12-14T10:47:23.705Z -INFO vmware-vmx.exe 22116 [ws@4413 threadName="vmx"] CPClipboard_SetItem: Set CPClipboard struct with data of size:11, format:1.
2025-12-14T10:47:35.344Z -INFO vmware-vmx.exe 22116 [ws@4413 threadName="vmx"] CPClipboard_SetItem: Set CPClipboard struct with data of size:40, format:1.
2025-12-14T10:49:32.536Z -INFO vmware-vmx.exe 22116 [ws@4413 threadName="vmx"] CPClipboard_SetItem: Set CPClipboard struct with data of size:18, format:1.
2025-12-14T10:54:20.467Z -INFO vmware-vmx.exe 22116 [ws@4413 threadName="vmx"] CPClipboard_SetItem: Set CPClipboard struct with data of size:185, format:1.
2025-12-14T10:56:24.663Z -INFO vmware-vmx.exe 22116 [ws@4413 threadName="vmx"] CPClipboard_SetItem: Set CPClipboard struct with data of size:224, format:1.
2025-12-14T11:01:49.070Z -INFO vmware-vmx.exe 22116 [ws@4413 threadName="vcpu-0"] SCSI DEVICE (scsi0:0): MODE SENSE(6) for unsupported page 0x8
2025-12-14T11:01:49.070Z -INFO vmware-vmx.exe 22116 [ws@4413 threadName="vcpu-0"] SCSI DEVICE (scsi0:0): MODE SENSE(6) for unsupported page 0x8
2025-12-14T11:01:49.073Z -INFO vmware-vmx.exe 22116 [ws@4413 threadName="vcpu-1"] SCSI DEVICE (scsi0:0): MODE SENSE(6) for unsupported page 0x8
2025-12-14T11:01:49.073Z -INFO vmware-vmx.exe 22116 [ws@4413 threadName="vcpu-1"] SCSI DEVICE (scsi0:0): MODE SENSE(6) for unsupported page 0x8
2025-12-14T11:01:49.075Z -INFO vmware-vmx.exe 22116 [ws@4413 threadName="vcpu-1"] SCSI DEVICE (scsi0:0): MODE SENSE(6) for unsupported page 0x8
2025-12-14T11:01:49.075Z -INFO vmware-vmx.exe 22116 [ws@4413 threadName="vcpu-1"] SCSI DEVICE (scsi0:0): MODE SENSE(6) for unsupported page 0x8
2025-12-14T11:01:49.077Z -INFO vmware-vmx.exe 22116 [ws@4413 threadName="vcpu-1"] SCSI DEVICE (scsi0:0): MODE SENSE(6) for unsupported page 0x8
2025-12-14T11:01:49.077Z -INFO vmware-vmx.exe 22116 [ws@4413 threadName="vcpu-1"] SCSI DEVICE (scsi0:0): MODE SENSE(6) for unsupported page 0x8
2025-12-14T11:01:49.079Z -INFO vmware-vmx.exe 22116 [ws@4413 threadName="vcpu-1"] SCSI DEVICE (scsi0:0): MODE SENSE(6) for unsupported page 0x8
2025-12-14T11:01:49.080Z -INFO vmware-vmx.exe 22116 [ws@4413 threadName="vcpu-1"] SCSI DEVICE (scsi0:0): MODE SENSE(6) for unsupported page 0x8
2025-12-14T11:01:49.084Z -INFO vmware-vmx.exe 22116 [ws@4413 threadName="vcpu-1"] SCSI DEVICE (scsi0:0): MODE SENSE(6) for unsupported page 0x8
2025-12-14T11:01:49.084Z -INFO vmware-vmx.exe 22116 [ws@4413 threadName="vcpu-1"] SCSI DEVICE (scsi0:0): MODE SENSE(6) for unsupported page 0x8
2025-12-14T11:02:04.442Z -INFO vmware-vmx.exe 22116 [ws@4413 threadName="vcpu-1"] SOUNDLIB: Creating WAVE backend stream.
2025-12-14T11:02:04.445Z -INFO vmware-vmx.exe 22116 [ws@4413 threadName="vcpu-1"] SOUNDLIB: SoundWaveSelectHostDevice: Found device Headset Earphone (Logitech Mono
2025-12-14T11:02:04.503Z -INFO vmware-vmx.exe 22116 [ws@4413 threadName="vcpu-1"] SOUNDLIB: SoundWaveComputeBufferParams: Initializing 9 buffers of length 3584, capable of holding a total of 182857 usecs of sound.
2025-12-14T11:02:04.504Z -INFO vmware-vmx.exe 22116 [ws@4413 threadName="soundWaveRecord1"] VTHREAD 4548 "soundWaveRecord1"
2025-12-14T11:02:04.504Z -INFO vmware-vmx.exe 22116 [ws@4413 threadName="soundWaveRecord1"] SOUNDLIB: SoundWaveThread: Poll thread entered : id(4548)
2025-12-14T11:02:04.504Z -INFO vmware-vmx.exe 22116 [ws@4413 threadName="vcpu-1"] SOUNDLIB: SoundWaveCreateStream: Created poll thread : id(4548)
2025-12-14T11:02:04.504Z -INFO vmware-vmx.exe 22116 [ws@4413 threadName="vcpu-1"] SOUNDLIB: Starting WAVE stream 2200889B4A0.
2025-12-14T11:02:04.540Z -INFO vmware-vmx.exe 22116 [ws@4413 threadName="vcpu-0"] SOUNDLIB: Creating WAVE backend stream.
2025-12-14T11:02:04.542Z -INFO vmware-vmx.exe 22116 [ws@4413 threadName="vcpu-0"] SOUNDLIB: SoundWaveSelectHostDevice: Found device Headset Earphone (Logitech Mono
2025-12-14T11:02:04.560Z -INFO vmware-vmx.exe 22116 [ws@4413 threadName="vcpu-0"] SOUNDLIB: SoundWaveComputeBufferParams: Initializing 10 buffers of length 3840, capable of holding a total of 200000 usecs of sound.
2025-12-14T11:02:04.561Z -INFO vmware-vmx.exe 22116 [ws@4413 threadName="soundWavePlayback12"] VTHREAD 21604 "soundWavePlayback12"
2025-12-14T11:02:04.561Z -INFO vmware-vmx.exe 22116 [ws@4413 threadName="soundWavePlayback12"] SOUNDLIB: SoundWaveThread: Poll thread entered : id(21604)
2025-12-14T11:02:04.561Z -INFO vmware-vmx.exe 22116 [ws@4413 threadName="vcpu-0"] SOUNDLIB: SoundWaveCreateStream: Created poll thread : id(21604)
2025-12-14T11:02:04.562Z -INFO vmware-vmx.exe 22116 [ws@4413 threadName="vcpu-0"] SOUNDLIB: Starting WAVE stream 2200889B720.
2025-12-14T11:02:55.461Z -INFO vmware-vmx.exe 22116 [ws@4413 threadName="vcpu-1"] SOUNDLIB: Stopping WAVE stream 2200889B4A0.
2025-12-14T11:02:55.462Z -INFO vmware-vmx.exe 22116 [ws@4413 threadName="soundWaveRecord1"] SOUNDLIB: SoundWavePoll: Poll invoked on a non-running stream; leaving early.
2025-12-14T11:02:55.463Z -INFO vmware-vmx.exe 22116 [ws@4413 threadName="vcpu-1"] SOUNDLIB: Closing WAVE stream 2200889B4A0.
2025-12-14T11:02:55.463Z -INFO vmware-vmx.exe 22116 [ws@4413 threadName="vcpu-1"] SOUNDLIB: SoundWaveCloseStream: Destroying poll thread : id(4548)
2025-12-14T11:02:55.463Z -INFO vmware-vmx.exe 22116 [ws@4413 threadName="soundWaveRecord1"] SOUNDLIB: SoundWaveThread: Poll thread exited : id(4548)
2025-12-14T11:02:55.943Z -INFO vmware-vmx.exe 22116 [ws@4413 threadName="vmx"] SOUNDLIB: Stopping WAVE stream 2200889B720.
2025-12-14T11:02:55.953Z -INFO vmware-vmx.exe 22116 [ws@4413 threadName="soundWavePlayback12"] SOUNDLIB: SoundWavePoll: Poll invoked on a non-running stream; leaving early.
2025-12-14T11:02:55.954Z -INFO vmware-vmx.exe 22116 [ws@4413 threadName="vmx"] SOUNDLIB: Closing WAVE stream 2200889B720.
2025-12-14T11:02:55.954Z -INFO vmware-vmx.exe 22116 [ws@4413 threadName="vmx"] SOUNDLIB: SoundWaveCloseStream: Destroying poll thread : id(21604)
2025-12-14T11:02:55.954Z -INFO vmware-vmx.exe 22116 [ws@4413 threadName="soundWavePlayback12"] SOUNDLIB: SoundWaveThread: Poll thread exited : id(21604)
2025-12-14T11:05:01.273Z -INFO vmware-vmx.exe 22116 [ws@4413 threadName="vmx"] MemSched: caller 0 numvm 1 locked pages: num 1516531 max 7264512
2025-12-14T11:05:01.273Z -INFO vmware-vmx.exe 22116 [ws@4413 threadName="vmx"] MemSched: locked Page Limit: host 7485191 config 7272704
2025-12-14T11:05:01.273Z -INFO vmware-vmx.exe 22116 [ws@4413 threadName="vmx"] MemSched: minmempct 50 timestamp 12812
2025-12-14T11:05:01.273Z -INFO vmware-vmx.exe 22116 [ws@4413 threadName="vmx"] MemSched: VM 0 min 799432 max 1585864 shares 1572864 paged 1330494 nonpaged 5264 anonymous 7736 locked 1516531 touchedPct 17 dirtiedPct 6 timestamp 12812 vmResponsive is 1
2025-12-14T11:05:01.273Z -INFO vmware-vmx.exe 22116 [ws@4413 threadName="vmx"] MemSched: locked 1516531 target 1585864 balloon 0 0 1022361 swapped 65182 0 allocd 34 512 state 0 100
2025-12-14T11:05:01.273Z -INFO vmware-vmx.exe 22116 [ws@4413 threadName="vmx"] MemSched: states: 0 7201 : 1 0 : 2 0 : 3 0
2025-12-14T11:05:01.273Z -INFO vmware-vmx.exe 22116 [ws@4413 threadName="vmx"] MemSched: Balloon enabled 1 guestType 4 maxSize 0
2025-12-14T11:05:34.548Z -INFO vmware-vmx.exe 22116 [ws@4413 threadName="vcpu-1"] DISKUTIL: scsi0:0 : capacity=83886080 logical sector size=512
2025-12-14T11:05:34.548Z -INFO vmware-vmx.exe 22116 [ws@4413 threadName="vcpu-0"] DISKUTIL: scsi0:0 : capacity=83886080 logical sector size=512
2025-12-14T11:07:01.671Z -INFO vmware-vmx.exe 22116 [ws@4413 threadName="vmx"] CPClipboard_SetItem: Set CPClipboard struct with data of size:78, format:1.
2025-12-14T11:09:02.215Z -INFO vmware-vmx.exe 22116 [ws@4413 threadName="vmx"] CPClipboard_SetItem: Set CPClipboard struct with data of size:39, format:1.
2025-12-14T11:09:44.342Z -INFO vmware-vmx.exe 22116 [ws@4413 threadName="vmx"] CPClipboard_SetItem: Set CPClipboard struct with data of size:24, format:1.
2025-12-14T11:10:34.731Z -INFO vmware-vmx.exe 22116 [ws@4413 threadName="vcpu-0"] DISKUTIL: scsi0:0 : capacity=83886080 logical sector size=512
2025-12-14T11:10:34.731Z -INFO vmware-vmx.exe 22116 [ws@4413 threadName="vcpu-0"] DISKUTIL: scsi0:0 : capacity=83886080 logical sector size=512
2025-12-14T11:11:37.862Z -INFO vmware-vmx.exe 22116 [ws@4413 threadName="vmx"] CPClipboard_SetItem: Set CPClipboard struct with data of size:141, format:1.
2025-12-14T11:14:02.998Z -INFO vmware-vmx.exe 22116 [ws@4413 threadName="vmx"] CPClipboard_SetItem: Set CPClipboard struct with data of size:9, format:1.
2025-12-14T11:14:47.214Z -INFO vmware-vmx.exe 22116 [ws@4413 threadName="vmx"] CPClipboard_SetItem: Set CPClipboard struct with data of size:9, format:1.
2025-12-14T11:15:40.990Z -INFO vmware-vmx.exe 22116 [ws@4413 threadName="vmx"] CPClipboard_SetItem: Set CPClipboard struct with data of size:151, format:1.
2025-12-14T11:16:52.967Z -INFO vmware-vmx.exe 22116 [ws@4413 threadName="vmx"] CPClipboard_SetItem: Set CPClipboard struct with data of size:1373072, format:6.
2025-12-14T11:20:55.238Z -INFO vmware-vmx.exe 22116 [ws@4413 threadName="vcpu-0"] SCSI DEVICE (scsi0:0): MODE SENSE(6) for unsupported page 0x8
2025-12-14T11:20:55.238Z -INFO vmware-vmx.exe 22116 [ws@4413 threadName="vcpu-0"] SCSI DEVICE (scsi0:0): MODE SENSE(6) for unsupported page 0x8
2025-12-14T11:20:55.240Z -INFO vmware-vmx.exe 22116 [ws@4413 threadName="vcpu-1"] SCSI DEVICE (scsi0:0): MODE SENSE(6) for unsupported page 0x8
2025-12-14T11:20:55.240Z -INFO vmware-vmx.exe 22116 [ws@4413 threadName="vcpu-1"] SCSI DEVICE (scsi0:0): MODE SENSE(6) for unsupported page 0x8
2025-12-14T11:20:55.243Z -INFO vmware-vmx.exe 22116 [ws@4413 threadName="vcpu-0"] SCSI DEVICE (scsi0:0): MODE SENSE(6) for unsupported page 0x8
2025-12-14T11:20:55.243Z -INFO vmware-vmx.exe 22116 [ws@4413 threadName="vcpu-0"] SCSI DEVICE (scsi0:0): MODE SENSE(6) for unsupported page 0x8
2025-12-14T11:20:55.244Z -INFO vmware-vmx.exe 22116 [ws@4413 threadName="vcpu-1"] SCSI DEVICE (scsi0:0): MODE SENSE(6) for unsupported page 0x8
2025-12-14T11:20:55.244Z -INFO vmware-vmx.exe 22116 [ws@4413 threadName="vcpu-1"] SCSI DEVICE (scsi0:0): MODE SENSE(6) for unsupported page 0x8
2025-12-14T11:20:55.246Z -INFO vmware-vmx.exe 22116 [ws@4413 threadName="vcpu-0"] SCSI DEVICE (scsi0:0): MODE SENSE(6) for unsupported page 0x8
2025-12-14T11:20:55.246Z -INFO vmware-vmx.exe 22116 [ws@4413 threadName="vcpu-0"] SCSI DEVICE (scsi0:0): MODE SENSE(6) for unsupported page 0x8
2025-12-14T11:21:03.030Z -INFO vmware-vmx.exe 22116 [ws@4413 threadName="vcpu-0"] SOUNDLIB: Creating WAVE backend stream.
2025-12-14T11:21:03.033Z -INFO vmware-vmx.exe 22116 [ws@4413 threadName="vcpu-0"] SOUNDLIB: SoundWaveSelectHostDevice: Found device Headset Earphone (Logitech Mono
2025-12-14T11:21:03.098Z -INFO vmware-vmx.exe 22116 [ws@4413 threadName="vcpu-0"] SOUNDLIB: SoundWaveComputeBufferParams: Initializing 10 buffers of length 3840, capable of holding a total of 200000 usecs of sound.
2025-12-14T11:21:03.099Z -INFO vmware-vmx.exe 22116 [ws@4413 threadName="soundWavePlayback13"] VTHREAD 24892 "soundWavePlayback13"
2025-12-14T11:21:03.099Z -INFO vmware-vmx.exe 22116 [ws@4413 threadName="soundWavePlayback13"] SOUNDLIB: SoundWaveThread: Poll thread entered : id(24892)
2025-12-14T11:21:03.099Z -INFO vmware-vmx.exe 22116 [ws@4413 threadName="vcpu-0"] SOUNDLIB: SoundWaveCreateStream: Created poll thread : id(24892)
2025-12-14T11:21:03.109Z -INFO vmware-vmx.exe 22116 [ws@4413 threadName="vcpu-0"] SOUNDLIB: Starting WAVE stream 2200889C4E0.
2025-12-14T11:21:08.437Z -INFO vmware-vmx.exe 22116 [ws@4413 threadName="vmx"] CPClipboard_SetItem: Set CPClipboard struct with data of size:1078827, format:6.
2025-12-14T11:21:09.499Z -INFO vmware-vmx.exe 22116 [ws@4413 threadName="vmx"] SOUNDLIB: Stopping WAVE stream 2200889C4E0.
2025-12-14T11:21:09.510Z -INFO vmware-vmx.exe 22116 [ws@4413 threadName="soundWavePlayback13"] SOUNDLIB: SoundWavePoll: Poll invoked on a non-running stream; leaving early.
2025-12-14T11:21:09.511Z -INFO vmware-vmx.exe 22116 [ws@4413 threadName="vmx"] SOUNDLIB: Closing WAVE stream 2200889C4E0.
2025-12-14T11:21:09.511Z -INFO vmware-vmx.exe 22116 [ws@4413 threadName="vmx"] SOUNDLIB: SoundWaveCloseStream: Destroying poll thread : id(24892)
2025-12-14T11:21:09.511Z -INFO vmware-vmx.exe 22116 [ws@4413 threadName="soundWavePlayback13"] SOUNDLIB: SoundWaveThread: Poll thread exited : id(24892)
2025-12-14T11:21:09.615Z -INFO vmware-vmx.exe 22116 [ws@4413 threadName="vcpu-1"] SOUNDLIB: Creating WAVE backend stream.
2025-12-14T11:21:09.617Z -INFO vmware-vmx.exe 22116 [ws@4413 threadName="vcpu-1"] SOUNDLIB: SoundWaveSelectHostDevice: Found device Headset Earphone (Logitech Mono
2025-12-14T11:21:09.632Z -INFO vmware-vmx.exe 22116 [ws@4413 threadName="vcpu-1"] SOUNDLIB: SoundWaveComputeBufferParams: Initializing 9 buffers of length 3584, capable of holding a total of 182857 usecs of sound.
2025-12-14T11:21:09.632Z -INFO vmware-vmx.exe 22116 [ws@4413 threadName="soundWaveRecord2"] VTHREAD 22716 "soundWaveRecord2"
2025-12-14T11:21:09.632Z -INFO vmware-vmx.exe 22116 [ws@4413 threadName="soundWaveRecord2"] SOUNDLIB: SoundWaveThread: Poll thread entered : id(22716)
2025-12-14T11:21:09.632Z -INFO vmware-vmx.exe 22116 [ws@4413 threadName="vcpu-1"] SOUNDLIB: SoundWaveCreateStream: Created poll thread : id(22716)
2025-12-14T11:21:09.632Z -INFO vmware-vmx.exe 22116 [ws@4413 threadName="vcpu-1"] SOUNDLIB: Starting WAVE stream 2200889C260.
2025-12-14T11:21:09.667Z -INFO vmware-vmx.exe 22116 [ws@4413 threadName="vcpu-0"] SOUNDLIB: Creating WAVE backend stream.
2025-12-14T11:21:09.669Z -INFO vmware-vmx.exe 22116 [ws@4413 threadName="vcpu-0"] SOUNDLIB: SoundWaveSelectHostDevice: Found device Headset Earphone (Logitech Mono
2025-12-14T11:21:09.683Z -INFO vmware-vmx.exe 22116 [ws@4413 threadName="vcpu-0"] SOUNDLIB: SoundWaveComputeBufferParams: Initializing 10 buffers of length 3840, capable of holding a total of 200000 usecs of sound.
2025-12-14T11:21:09.683Z -INFO vmware-vmx.exe 22116 [ws@4413 threadName="soundWavePlayback14"] VTHREAD 652 "soundWavePlayback14"
2025-12-14T11:21:09.683Z -INFO vmware-vmx.exe 22116 [ws@4413 threadName="soundWavePlayback14"] SOUNDLIB: SoundWaveThread: Poll thread entered : id(652)
2025-12-14T11:21:09.683Z -INFO vmware-vmx.exe 22116 [ws@4413 threadName="vcpu-0"] SOUNDLIB: SoundWaveCreateStream: Created poll thread : id(652)
2025-12-14T11:21:09.688Z -INFO vmware-vmx.exe 22116 [ws@4413 threadName="vcpu-0"] SOUNDLIB: Starting WAVE stream 2200889BD60.
2025-12-14T11:35:01.682Z -INFO vmware-vmx.exe 22116 [ws@4413 threadName="vmx"] MemSched: caller 0 numvm 1 locked pages: num 1502011 max 7264512
2025-12-14T11:35:01.682Z -INFO vmware-vmx.exe 22116 [ws@4413 threadName="vmx"] MemSched: locked Page Limit: host 7472096 config 7272704
2025-12-14T11:35:01.682Z -INFO vmware-vmx.exe 22116 [ws@4413 threadName="vmx"] MemSched: minmempct 50 timestamp 14612
2025-12-14T11:35:01.682Z -INFO vmware-vmx.exe 22116 [ws@4413 threadName="vmx"] MemSched: VM 0 min 799432 max 1585864 shares 1572864 paged 1330494 nonpaged 5264 anonymous 7736 locked 1502011 touchedPct 23 dirtiedPct 10 timestamp 14612 vmResponsive is 1
2025-12-14T11:35:01.682Z -INFO vmware-vmx.exe 22116 [ws@4413 threadName="vmx"] MemSched: locked 1502011 target 1585864 balloon 0 0 1022361 swapped 79699 0 allocd 4 512 state 0 100
2025-12-14T11:35:01.682Z -INFO vmware-vmx.exe 22116 [ws@4413 threadName="vmx"] MemSched: states: 0 9001 : 1 0 : 2 0 : 3 0
2025-12-14T11:35:01.682Z -INFO vmware-vmx.exe 22116 [ws@4413 threadName="vmx"] MemSched: Balloon enabled 1 guestType 4 maxSize 0
2025-12-14T11:45:23.273Z -INFO vmware-vmx.exe 22116 [ws@4413 threadName="vcpu-1"] SCSI DEVICE (scsi0:0): MODE SENSE(6) for unsupported page 0x8
2025-12-14T11:45:23.273Z -INFO vmware-vmx.exe 22116 [ws@4413 threadName="vcpu-1"] SCSI DEVICE (scsi0:0): MODE SENSE(6) for unsupported page 0x8
2025-12-14T11:45:23.275Z -INFO vmware-vmx.exe 22116 [ws@4413 threadName="vcpu-0"] SCSI DEVICE (scsi0:0): MODE SENSE(6) for unsupported page 0x8
2025-12-14T11:45:23.275Z -INFO vmware-vmx.exe 22116 [ws@4413 threadName="vcpu-0"] SCSI DEVICE (scsi0:0): MODE SENSE(6) for unsupported page 0x8
2025-12-14T11:45:23.278Z -INFO vmware-vmx.exe 22116 [ws@4413 threadName="vcpu-1"] SCSI DEVICE (scsi0:0): MODE SENSE(6) for unsupported page 0x8
2025-12-14T11:45:23.278Z -INFO vmware-vmx.exe 22116 [ws@4413 threadName="vcpu-1"] SCSI DEVICE (scsi0:0): MODE SENSE(6) for unsupported page 0x8
2025-12-14T11:45:23.280Z -INFO vmware-vmx.exe 22116 [ws@4413 threadName="vcpu-0"] SCSI DEVICE (scsi0:0): MODE SENSE(6) for unsupported page 0x8
2025-12-14T11:45:23.280Z -INFO vmware-vmx.exe 22116 [ws@4413 threadName="vcpu-0"] SCSI DEVICE (scsi0:0): MODE SENSE(6) for unsupported page 0x8
2025-12-14T11:45:23.282Z -INFO vmware-vmx.exe 22116 [ws@4413 threadName="vcpu-1"] SCSI DEVICE (scsi0:0): MODE SENSE(6) for unsupported page 0x8
2025-12-14T11:45:23.282Z -INFO vmware-vmx.exe 22116 [ws@4413 threadName="vcpu-1"] SCSI DEVICE (scsi0:0): MODE SENSE(6) for unsupported page 0x8
2025-12-14T11:45:23.287Z -INFO vmware-vmx.exe 22116 [ws@4413 threadName="vcpu-0"] SCSI DEVICE (scsi0:0): MODE SENSE(6) for unsupported page 0x8
2025-12-14T11:45:23.287Z -INFO vmware-vmx.exe 22116 [ws@4413 threadName="vcpu-0"] SCSI DEVICE (scsi0:0): MODE SENSE(6) for unsupported page 0x8
2025-12-14T11:46:00.040Z -INFO vmware-vmx.exe 22116 [ws@4413 threadName="vcpu-1"] SOUNDLIB: Stopping WAVE stream 2200889C260.
2025-12-14T11:46:00.049Z -INFO vmware-vmx.exe 22116 [ws@4413 threadName="soundWaveRecord2"] SOUNDLIB: SoundWavePoll: Poll invoked on a non-running stream; leaving early.
2025-12-14T11:46:00.051Z -INFO vmware-vmx.exe 22116 [ws@4413 threadName="vcpu-1"] SOUNDLIB: Closing WAVE stream 2200889C260.
2025-12-14T11:46:00.051Z -INFO vmware-vmx.exe 22116 [ws@4413 threadName="vcpu-1"] SOUNDLIB: SoundWaveCloseStream: Destroying poll thread : id(22716)
2025-12-14T11:46:00.051Z -INFO vmware-vmx.exe 22116 [ws@4413 threadName="soundWaveRecord2"] SOUNDLIB: SoundWaveThread: Poll thread exited : id(22716)
2025-12-14T11:46:00.539Z -INFO vmware-vmx.exe 22116 [ws@4413 threadName="vmx"] SOUNDLIB: Stopping WAVE stream 2200889BD60.
2025-12-14T11:46:00.550Z -INFO vmware-vmx.exe 22116 [ws@4413 threadName="soundWavePlayback14"] SOUNDLIB: SoundWavePoll: Poll invoked on a non-running stream; leaving early.
2025-12-14T11:46:00.551Z -INFO vmware-vmx.exe 22116 [ws@4413 threadName="vmx"] SOUNDLIB: Closing WAVE stream 2200889BD60.
2025-12-14T11:46:00.551Z -INFO vmware-vmx.exe 22116 [ws@4413 threadName="vmx"] SOUNDLIB: SoundWaveCloseStream: Destroying poll thread : id(652)
2025-12-14T11:46:00.551Z -INFO vmware-vmx.exe 22116 [ws@4413 threadName="soundWavePlayback14"] SOUNDLIB: SoundWaveThread: Poll thread exited : id(652)
2025-12-14T11:47:07.414Z -INFO vmware-vmx.exe 22116 [ws@4413 threadName="vmx"] CPClipboard_SetItem: Set CPClipboard struct with data of size:9, format:1.
2025-12-14T11:47:08.133Z -INFO vmware-vmx.exe 22116 [ws@4413 threadName="vcpu-1"] DISKUTIL: scsi0:0 : capacity=83886080 logical sector size=512
2025-12-14T11:47:08.448Z -INFO vmware-vmx.exe 22116 [ws@4413 threadName="vcpu-0"] DISKUTIL: scsi0:0 : capacity=83886080 logical sector size=512
2025-12-14T11:47:14.292Z -INFO vmware-vmx.exe 22116 [ws@4413 threadName="vmx"] CPClipboard_SetItem: Set CPClipboard struct with data of size:9, format:1.
2025-12-14T11:47:41.016Z -INFO vmware-vmx.exe 22116 [ws@4413 threadName="vmx"] CPClipboard_SetItem: Set CPClipboard struct with data of size:79, format:1.
2025-12-14T11:47:57.836Z -INFO vmware-vmx.exe 22116 [ws@4413 threadName="vmx"] DISKLIB-LIB : numIOs = 250000 numMergedIOs = 69383 numSplitIOs = 8471
2025-12-14T11:53:12.131Z -INFO vmware-vmx.exe 22116 [ws@4413 threadName="vmx"] CPClipboard_SetItem: Set CPClipboard struct with data of size:1159207, format:6.
2025-12-14T11:56:26.324Z -INFO vmware-vmx.exe 22116 [ws@4413 threadName="vcpu-0"] SOUNDLIB: Creating WAVE backend stream.
2025-12-14T11:56:26.326Z -INFO vmware-vmx.exe 22116 [ws@4413 threadName="vcpu-0"] SOUNDLIB: SoundWaveSelectHostDevice: Found device Headset Earphone (Logitech Mono
2025-12-14T11:56:26.395Z -INFO vmware-vmx.exe 22116 [ws@4413 threadName="vcpu-0"] SOUNDLIB: SoundWaveComputeBufferParams: Initializing 10 buffers of length 3840, capable of holding a total of 200000 usecs of sound.
2025-12-14T11:56:26.395Z -INFO vmware-vmx.exe 22116 [ws@4413 threadName="soundWavePlayback15"] VTHREAD 24904 "soundWavePlayback15"
2025-12-14T11:56:26.395Z -INFO vmware-vmx.exe 22116 [ws@4413 threadName="soundWavePlayback15"] SOUNDLIB: SoundWaveThread: Poll thread entered : id(24904)
2025-12-14T11:56:26.395Z -INFO vmware-vmx.exe 22116 [ws@4413 threadName="vcpu-0"] SOUNDLIB: SoundWaveCreateStream: Created poll thread : id(24904)
2025-12-14T11:56:26.406Z -INFO vmware-vmx.exe 22116 [ws@4413 threadName="vcpu-0"] SOUNDLIB: Starting WAVE stream 2200889AFA0.
2025-12-14T11:56:28.021Z -INFO vmware-vmx.exe 22116 [ws@4413 threadName="vmx"] SOUNDLIB: Stopping WAVE stream 2200889AFA0.
2025-12-14T11:56:28.032Z -INFO vmware-vmx.exe 22116 [ws@4413 threadName="soundWavePlayback15"] SOUNDLIB: SoundWavePoll: Poll invoked on a non-running stream; leaving early.
2025-12-14T11:56:28.033Z -INFO vmware-vmx.exe 22116 [ws@4413 threadName="vmx"] SOUNDLIB: Closing WAVE stream 2200889AFA0.
2025-12-14T11:56:28.033Z -INFO vmware-vmx.exe 22116 [ws@4413 threadName="vmx"] SOUNDLIB: SoundWaveCloseStream: Destroying poll thread : id(24904)
2025-12-14T11:56:28.033Z -INFO vmware-vmx.exe 22116 [ws@4413 threadName="soundWavePlayback15"] SOUNDLIB: SoundWaveThread: Poll thread exited : id(24904)
2025-12-14T12:02:23.406Z -INFO vmware-vmx.exe 22116 [ws@4413 threadName="vcpu-0"] SCSI DEVICE (scsi0:0): MODE SENSE(6) for unsupported page 0x8
2025-12-14T12:02:23.406Z -INFO vmware-vmx.exe 22116 [ws@4413 threadName="vcpu-0"] SCSI DEVICE (scsi0:0): MODE SENSE(6) for unsupported page 0x8
2025-12-14T12:02:23.408Z -INFO vmware-vmx.exe 22116 [ws@4413 threadName="vcpu-0"] SCSI DEVICE (scsi0:0): MODE SENSE(6) for unsupported page 0x8
2025-12-14T12:02:23.408Z -INFO vmware-vmx.exe 22116 [ws@4413 threadName="vcpu-0"] SCSI DEVICE (scsi0:0): MODE SENSE(6) for unsupported page 0x8
2025-12-14T12:02:23.411Z -INFO vmware-vmx.exe 22116 [ws@4413 threadName="vcpu-0"] SCSI DEVICE (scsi0:0): MODE SENSE(6) for unsupported page 0x8
2025-12-14T12:02:23.411Z -INFO vmware-vmx.exe 22116 [ws@4413 threadName="vcpu-0"] SCSI DEVICE (scsi0:0): MODE SENSE(6) for unsupported page 0x8
2025-12-14T12:02:23.414Z -INFO vmware-vmx.exe 22116 [ws@4413 threadName="vcpu-0"] SCSI DEVICE (scsi0:0): MODE SENSE(6) for unsupported page 0x8
2025-12-14T12:02:23.414Z -INFO vmware-vmx.exe 22116 [ws@4413 threadName="vcpu-0"] SCSI DEVICE (scsi0:0): MODE SENSE(6) for unsupported page 0x8
2025-12-14T12:02:23.417Z -INFO vmware-vmx.exe 22116 [ws@4413 threadName="vcpu-0"] SCSI DEVICE (scsi0:0): MODE SENSE(6) for unsupported page 0x8
2025-12-14T12:02:23.417Z -INFO vmware-vmx.exe 22116 [ws@4413 threadName="vcpu-0"] SCSI DEVICE (scsi0:0): MODE SENSE(6) for unsupported page 0x8
2025-12-14T12:02:23.419Z -INFO vmware-vmx.exe 22116 [ws@4413 threadName="vcpu-0"] SCSI DEVICE (scsi0:0): MODE SENSE(6) for unsupported page 0x8
2025-12-14T12:02:23.419Z -INFO vmware-vmx.exe 22116 [ws@4413 threadName="vcpu-0"] SCSI DEVICE (scsi0:0): MODE SENSE(6) for unsupported page 0x8
2025-12-14T12:05:02.083Z -INFO vmware-vmx.exe 22116 [ws@4413 threadName="vmx"] MemSched: caller 0 numvm 1 locked pages: num 1485714 max 6920788
2025-12-14T12:05:02.083Z -INFO vmware-vmx.exe 22116 [ws@4413 threadName="vmx"] MemSched: locked Page Limit: host 6928980 config 7272704
2025-12-14T12:05:02.083Z -INFO vmware-vmx.exe 22116 [ws@4413 threadName="vmx"] MemSched: minmempct 50 timestamp 16413
2025-12-14T12:05:02.083Z -INFO vmware-vmx.exe 22116 [ws@4413 threadName="vmx"] MemSched: VM 0 min 799432 max 1585864 shares 1572864 paged 1330494 nonpaged 5264 anonymous 7736 locked 1485714 touchedPct 22 dirtiedPct 1 timestamp 16413 vmResponsive is 1
2025-12-14T12:05:02.083Z -INFO vmware-vmx.exe 22116 [ws@4413 threadName="vmx"] MemSched: locked 1485714 target 1585864 balloon 0 0 1022361 swapped 95990 0 allocd 3 512 state 0 100
2025-12-14T12:05:02.083Z -INFO vmware-vmx.exe 22116 [ws@4413 threadName="vmx"] MemSched: states: 0 10801 : 1 0 : 2 0 : 3 0
2025-12-14T12:05:02.083Z -INFO vmware-vmx.exe 22116 [ws@4413 threadName="vmx"] MemSched: Balloon enabled 1 guestType 4 maxSize 0
2025-12-14T12:05:21.278Z -INFO vmware-vmx.exe 22116 [ws@4413 threadName="vmx"] CPClipboard_SetItem: Set CPClipboard struct with data of size:25, format:1.
2025-12-14T12:05:51.897Z -INFO vmware-vmx.exe 22116 [ws@4413 threadName="vcpu-1"] DISKUTIL: scsi0:0 : capacity=83886080 logical sector size=512
2025-12-14T12:05:52.466Z -INFO vmware-vmx.exe 22116 [ws@4413 threadName="vcpu-0"] DISKUTIL: scsi0:0 : capacity=83886080 logical sector size=512
2025-12-14T12:05:52.466Z -INFO vmware-vmx.exe 22116 [ws@4413 threadName="vcpu-0"] DISKUTIL: scsi0:0 : capacity=83886080 logical sector size=512
2025-12-14T12:05:53.762Z -INFO vmware-vmx.exe 22116 [ws@4413 threadName="vmx"] USB: New set of 2 USB devices.
2025-12-14T12:05:53.762Z -INFO vmware-vmx.exe 22116 [ws@4413 threadName="vmx"] USB: Found device [name:Logitech\ Mono\ H650e vid:046d pid:0a47 path:1/0/9 speed:full family:audio,hid instanceId:USB\\VID_046D&PID_0A47\\00000000 serialnum:00000000 arbRuntimeKey:3 version:5]
2025-12-14T12:05:53.762Z -INFO vmware-vmx.exe 22116 [ws@4413 threadName="vmx"] USB: Found device [name:Yubico.com\ YubiKey\ OTP vid:1050 pid:0401 path:1/0/11 speed:full family:hid,hid-bootable instanceId:USB\\VID_1050&PID_0401\\5&1C5CE6EE&0&12 disconnected:1 arbRuntimeKey:4 quirks:allow version:5]
2025-12-14T12:05:54.362Z -INFO vmware-vmx.exe 22116 [ws@4413 threadName="vmx"] USB: New set of 1 USB devices.
2025-12-14T12:05:54.362Z -INFO vmware-vmx.exe 22116 [ws@4413 threadName="vmx"] USB: Found device [name:Logitech\ Mono\ H650e vid:046d pid:0a47 path:1/0/9 speed:full family:audio,hid instanceId:USB\\VID_046D&PID_0A47\\00000000 serialnum:00000000 arbRuntimeKey:3 version:5]
2025-12-14T12:07:37.691Z -INFO vmware-vmx.exe 22116 [ws@4413 threadName="vmx"] USB: New set of 2 USB devices.
2025-12-14T12:07:37.691Z -INFO vmware-vmx.exe 22116 [ws@4413 threadName="vmx"] USB: Found device [name:Logitech\ Mono\ H650e vid:046d pid:0a47 path:1/0/9 speed:full family:audio,hid instanceId:USB\\VID_046D&PID_0A47\\00000000 serialnum:00000000 arbRuntimeKey:3 version:5]
2025-12-14T12:07:37.691Z -INFO vmware-vmx.exe 22116 [ws@4413 threadName="vmx"] USB: Found device [name:HP\ LaserJet\ MFP\ M426dw vid:03f0 pid:532a path:1/0/12 speed:high family:vendor,printer instanceId:USB\\VID_0E0F&PID_0001\\PHBLM1Z858 serialnum:PHBLM1Z858 disconnected:1 arbRuntimeKey:5 version:5]
2025-12-14T12:07:37.896Z -INFO vmware-vmx.exe 22116 [ws@4413 threadName="vmx"] USB: New set of 2 USB devices.
2025-12-14T12:07:37.896Z -INFO vmware-vmx.exe 22116 [ws@4413 threadName="vmx"] USB: Found device [name:Logitech\ Mono\ H650e vid:046d pid:0a47 path:1/0/9 speed:full family:audio,hid instanceId:USB\\VID_046D&PID_0A47\\00000000 serialnum:00000000 arbRuntimeKey:3 version:5]
2025-12-14T12:07:37.896Z -INFO vmware-vmx.exe 22116 [ws@4413 threadName="vmx"] USB: Found device [name:HP\ LaserJet\ MFP\ M426dw vid:03f0 pid:532a path:1/0/12 speed:high family:vendor,printer instanceId:USB\\VID_03F0&PID_532A\\PHBLM1Z858 serialnum:PHBLM1Z858 arbRuntimeKey:5 version:5]
2025-12-14T12:09:32.004Z -INFO vmware-vmx.exe 22116 [ws@4413 threadName="vcpu-1"] SOUNDLIB: Creating WAVE backend stream.
2025-12-14T12:09:32.007Z -INFO vmware-vmx.exe 22116 [ws@4413 threadName="vcpu-1"] SOUNDLIB: SoundWaveSelectHostDevice: Found device Headset Earphone (Logitech Mono
2025-12-14T12:09:32.033Z -INFO vmware-vmx.exe 22116 [ws@4413 threadName="vcpu-1"] SOUNDLIB: SoundWaveComputeBufferParams: Initializing 10 buffers of length 3840, capable of holding a total of 200000 usecs of sound.
2025-12-14T12:09:32.033Z -INFO vmware-vmx.exe 22116 [ws@4413 threadName="soundWavePlayback16"] VTHREAD 24976 "soundWavePlayback16"
2025-12-14T12:09:32.034Z -INFO vmware-vmx.exe 22116 [ws@4413 threadName="soundWavePlayback16"] SOUNDLIB: SoundWaveThread: Poll thread entered : id(24976)
2025-12-14T12:09:32.034Z -INFO vmware-vmx.exe 22116 [ws@4413 threadName="vcpu-1"] SOUNDLIB: SoundWaveCreateStream: Created poll thread : id(24976)
2025-12-14T12:09:32.034Z -INFO vmware-vmx.exe 22116 [ws@4413 threadName="vcpu-0"] SOUNDLIB: Starting WAVE stream 2200889C4E0.
2025-12-14T12:09:37.296Z -INFO vmware-vmx.exe 22116 [ws@4413 threadName="vcpu-1"] SOUNDLIB: Creating WAVE backend stream.
2025-12-14T12:09:37.298Z -INFO vmware-vmx.exe 22116 [ws@4413 threadName="vcpu-1"] SOUNDLIB: SoundWaveSelectHostDevice: Found device Headset Earphone (Logitech Mono
2025-12-14T12:09:37.312Z -INFO vmware-vmx.exe 22116 [ws@4413 threadName="vcpu-1"] SOUNDLIB: SoundWaveComputeBufferParams: Initializing 9 buffers of length 3584, capable of holding a total of 182857 usecs of sound.
2025-12-14T12:09:37.312Z -INFO vmware-vmx.exe 22116 [ws@4413 threadName="soundWaveRecord3"] VTHREAD 4788 "soundWaveRecord3"
2025-12-14T12:09:37.312Z -INFO vmware-vmx.exe 22116 [ws@4413 threadName="soundWaveRecord3"] SOUNDLIB: SoundWaveThread: Poll thread entered : id(4788)
2025-12-14T12:09:37.312Z -INFO vmware-vmx.exe 22116 [ws@4413 threadName="vcpu-1"] SOUNDLIB: SoundWaveCreateStream: Created poll thread : id(4788)
2025-12-14T12:09:37.312Z -INFO vmware-vmx.exe 22116 [ws@4413 threadName="vcpu-1"] SOUNDLIB: Starting WAVE stream 2200889BAE0.
2025-12-14T12:13:35.191Z -INFO vmware-vmx.exe 22116 [ws@4413 threadName="vcpu-1"] SOUNDLIB: Stopping WAVE stream 2200889BAE0.
2025-12-14T12:13:35.201Z -INFO vmware-vmx.exe 22116 [ws@4413 threadName="soundWaveRecord3"] SOUNDLIB: SoundWavePoll: Poll invoked on a non-running stream; leaving early.
2025-12-14T12:13:35.205Z -INFO vmware-vmx.exe 22116 [ws@4413 threadName="vcpu-1"] SOUNDLIB: Closing WAVE stream 2200889BAE0.
2025-12-14T12:13:35.205Z -INFO vmware-vmx.exe 22116 [ws@4413 threadName="vcpu-1"] SOUNDLIB: SoundWaveCloseStream: Destroying poll thread : id(4788)
2025-12-14T12:13:35.206Z -INFO vmware-vmx.exe 22116 [ws@4413 threadName="soundWaveRecord3"] SOUNDLIB: SoundWaveThread: Poll thread exited : id(4788)
2025-12-14T12:13:35.666Z -INFO vmware-vmx.exe 22116 [ws@4413 threadName="vmx"] SOUNDLIB: Stopping WAVE stream 2200889C4E0.
2025-12-14T12:13:35.676Z -INFO vmware-vmx.exe 22116 [ws@4413 threadName="soundWavePlayback16"] SOUNDLIB: SoundWavePoll: Poll invoked on a non-running stream; leaving early.
2025-12-14T12:13:35.677Z -INFO vmware-vmx.exe 22116 [ws@4413 threadName="vmx"] SOUNDLIB: Closing WAVE stream 2200889C4E0.
2025-12-14T12:13:35.677Z -INFO vmware-vmx.exe 22116 [ws@4413 threadName="vmx"] SOUNDLIB: SoundWaveCloseStream: Destroying poll thread : id(24976)
2025-12-14T12:13:35.677Z -INFO vmware-vmx.exe 22116 [ws@4413 threadName="soundWavePlayback16"] SOUNDLIB: SoundWaveThread: Poll thread exited : id(24976)
2025-12-14T12:17:41.633Z -INFO vmware-vmx.exe 22116 [ws@4413 threadName="vcpu-1"] SCSI DEVICE (scsi0:0): MODE SENSE(6) for unsupported page 0x8
2025-12-14T12:17:41.633Z -INFO vmware-vmx.exe 22116 [ws@4413 threadName="vcpu-1"] SCSI DEVICE (scsi0:0): MODE SENSE(6) for unsupported page 0x8
2025-12-14T12:17:41.635Z -INFO vmware-vmx.exe 22116 [ws@4413 threadName="vcpu-0"] SCSI DEVICE (scsi0:0): MODE SENSE(6) for unsupported page 0x8
2025-12-14T12:17:41.635Z -INFO vmware-vmx.exe 22116 [ws@4413 threadName="vcpu-0"] SCSI DEVICE (scsi0:0): MODE SENSE(6) for unsupported page 0x8
2025-12-14T12:17:41.643Z -INFO vmware-vmx.exe 22116 [ws@4413 threadName="vcpu-0"] SCSI DEVICE (scsi0:0): MODE SENSE(6) for unsupported page 0x8
2025-12-14T12:17:41.643Z -INFO vmware-vmx.exe 22116 [ws@4413 threadName="vcpu-0"] SCSI DEVICE (scsi0:0): MODE SENSE(6) for unsupported page 0x8
2025-12-14T12:17:41.651Z -INFO vmware-vmx.exe 22116 [ws@4413 threadName="vcpu-0"] SCSI DEVICE (scsi0:0): MODE SENSE(6) for unsupported page 0x8
2025-12-14T12:17:41.651Z -INFO vmware-vmx.exe 22116 [ws@4413 threadName="vcpu-0"] SCSI DEVICE (scsi0:0): MODE SENSE(6) for unsupported page 0x8
2025-12-14T12:17:41.654Z -INFO vmware-vmx.exe 22116 [ws@4413 threadName="vcpu-0"] SCSI DEVICE (scsi0:0): MODE SENSE(6) for unsupported page 0x8
2025-12-14T12:17:41.654Z -INFO vmware-vmx.exe 22116 [ws@4413 threadName="vcpu-0"] SCSI DEVICE (scsi0:0): MODE SENSE(6) for unsupported page 0x8
2025-12-14T12:17:41.657Z -INFO vmware-vmx.exe 22116 [ws@4413 threadName="vcpu-1"] SCSI DEVICE (scsi0:0): MODE SENSE(6) for unsupported page 0x8
2025-12-14T12:17:41.657Z -INFO vmware-vmx.exe 22116 [ws@4413 threadName="vcpu-1"] SCSI DEVICE (scsi0:0): MODE SENSE(6) for unsupported page 0x8
2025-12-14T12:17:53.906Z -INFO vmware-vmx.exe 22116 [ws@4413 threadName="vmx"] USB: New set of 2 USB devices.
2025-12-14T12:17:53.906Z -INFO vmware-vmx.exe 22116 [ws@4413 threadName="vmx"] USB: Found device [name:Logitech\ Mono\ H650e vid:046d pid:0a47 path:1/0/9 speed:full family:audio,hid instanceId:USB\\VID_046D&PID_0A47\\00000000 serialnum:00000000 arbRuntimeKey:3 version:5]
2025-12-14T12:17:53.906Z -INFO vmware-vmx.exe 22116 [ws@4413 threadName="vmx"] USB: Found device [name:HP\ LaserJet\ MFP\ M426dw vid:03f0 pid:532a path:1/0/12 speed:high family:vendor,printer,video instanceId:USB\\VID_03F0&PID_532A\\PHBLM1Z858 serialnum:PHBLM1Z858 disconnected:1 arbRuntimeKey:5 version:5]
2025-12-14T12:17:54.507Z -INFO vmware-vmx.exe 22116 [ws@4413 threadName="vmx"] USB: New set of 1 USB devices.
2025-12-14T12:17:54.507Z -INFO vmware-vmx.exe 22116 [ws@4413 threadName="vmx"] USB: Found device [name:Logitech\ Mono\ H650e vid:046d pid:0a47 path:1/0/9 speed:full family:audio,hid instanceId:USB\\VID_046D&PID_0A47\\00000000 serialnum:00000000 arbRuntimeKey:3 version:5]
2025-12-14T12:35:02.761Z -INFO vmware-vmx.exe 22116 [ws@4413 threadName="vmx"] MemSched: caller 0 numvm 1 locked pages: num 1465110 max 7264512
2025-12-14T12:35:02.761Z -INFO vmware-vmx.exe 22116 [ws@4413 threadName="vmx"] MemSched: locked Page Limit: host 7361569 config 7272704
2025-12-14T12:35:02.761Z -INFO vmware-vmx.exe 22116 [ws@4413 threadName="vmx"] MemSched: minmempct 50 timestamp 18213
2025-12-14T12:35:02.761Z -INFO vmware-vmx.exe 22116 [ws@4413 threadName="vmx"] MemSched: VM 0 min 799432 max 1585864 shares 1572864 paged 1330494 nonpaged 5264 anonymous 7736 locked 1465110 touchedPct 12 dirtiedPct 1 timestamp 18213 vmResponsive is 1
2025-12-14T12:35:02.761Z -INFO vmware-vmx.exe 22116 [ws@4413 threadName="vmx"] MemSched: locked 1465110 target 1585864 balloon 0 0 1022361 swapped 116612 0 allocd 0 512 state 0 100
2025-12-14T12:35:02.761Z -INFO vmware-vmx.exe 22116 [ws@4413 threadName="vmx"] MemSched: states: 0 12601 : 1 0 : 2 0 : 3 0
2025-12-14T12:35:02.761Z -INFO vmware-vmx.exe 22116 [ws@4413 threadName="vmx"] MemSched: Balloon enabled 1 guestType 4 maxSize 0
2025-12-14T12:53:58.513Z -INFO vmware-vmx.exe 22116 [ws@4413 threadName="vcpu-0"] DISKUTIL: scsi0:0 : capacity=83886080 logical sector size=512
2025-12-14T12:53:58.513Z -INFO vmware-vmx.exe 22116 [ws@4413 threadName="vcpu-0"] DISKUTIL: scsi0:0 : capacity=83886080 logical sector size=512
2025-12-14T13:05:03.599Z -INFO vmware-vmx.exe 22116 [ws@4413 threadName="vmx"] MemSched: caller 0 numvm 1 locked pages: num 1439773 max 7264512
2025-12-14T13:05:03.599Z -INFO vmware-vmx.exe 22116 [ws@4413 threadName="vmx"] MemSched: locked Page Limit: host 7361603 config 7272704
2025-12-14T13:05:03.599Z -INFO vmware-vmx.exe 22116 [ws@4413 threadName="vmx"] MemSched: minmempct 50 timestamp 20014
2025-12-14T13:05:03.599Z -INFO vmware-vmx.exe 22116 [ws@4413 threadName="vmx"] MemSched: VM 0 min 799432 max 1585864 shares 1572864 paged 1330494 nonpaged 5264 anonymous 7736 locked 1439773 touchedPct 11 dirtiedPct 3 timestamp 20014 vmResponsive is 1
2025-12-14T13:05:03.599Z -INFO vmware-vmx.exe 22116 [ws@4413 threadName="vmx"] MemSched: locked 1439773 target 1585864 balloon 0 0 1022361 swapped 141922 0 allocd 0 512 state 0 100
2025-12-14T13:05:03.599Z -INFO vmware-vmx.exe 22116 [ws@4413 threadName="vmx"] MemSched: states: 0 14401 : 1 0 : 2 0 : 3 0
2025-12-14T13:05:03.599Z -INFO vmware-vmx.exe 22116 [ws@4413 threadName="vmx"] MemSched: Balloon enabled 1 guestType 4 maxSize 0
2025-12-14T13:18:22.697Z -INFO vmware-vmx.exe 22116 [ws@4413 threadName="vcpu-1"] SCSI DEVICE (scsi0:0): MODE SENSE(6) for unsupported page 0x8
2025-12-14T13:18:22.697Z -INFO vmware-vmx.exe 22116 [ws@4413 threadName="vcpu-1"] SCSI DEVICE (scsi0:0): MODE SENSE(6) for unsupported page 0x8
2025-12-14T13:18:22.699Z -INFO vmware-vmx.exe 22116 [ws@4413 threadName="vcpu-1"] SCSI DEVICE (scsi0:0): MODE SENSE(6) for unsupported page 0x8
2025-12-14T13:18:22.699Z -INFO vmware-vmx.exe 22116 [ws@4413 threadName="vcpu-1"] SCSI DEVICE (scsi0:0): MODE SENSE(6) for unsupported page 0x8
2025-12-14T13:18:22.703Z -INFO vmware-vmx.exe 22116 [ws@4413 threadName="vcpu-1"] SCSI DEVICE (scsi0:0): MODE SENSE(6) for unsupported page 0x8
2025-12-14T13:18:22.703Z -INFO vmware-vmx.exe 22116 [ws@4413 threadName="vcpu-1"] SCSI DEVICE (scsi0:0): MODE SENSE(6) for unsupported page 0x8
2025-12-14T13:18:22.706Z -INFO vmware-vmx.exe 22116 [ws@4413 threadName="vcpu-0"] SCSI DEVICE (scsi0:0): MODE SENSE(6) for unsupported page 0x8
2025-12-14T13:18:22.706Z -INFO vmware-vmx.exe 22116 [ws@4413 threadName="vcpu-0"] SCSI DEVICE (scsi0:0): MODE SENSE(6) for unsupported page 0x8
2025-12-14T13:18:22.709Z -INFO vmware-vmx.exe 22116 [ws@4413 threadName="vcpu-1"] SCSI DEVICE (scsi0:0): MODE SENSE(6) for unsupported page 0x8
2025-12-14T13:18:22.709Z -INFO vmware-vmx.exe 22116 [ws@4413 threadName="vcpu-1"] SCSI DEVICE (scsi0:0): MODE SENSE(6) for unsupported page 0x8
2025-12-14T13:18:22.714Z -INFO vmware-vmx.exe 22116 [ws@4413 threadName="vcpu-1"] SCSI DEVICE (scsi0:0): MODE SENSE(6) for unsupported page 0x8
2025-12-14T13:18:22.714Z -INFO vmware-vmx.exe 22116 [ws@4413 threadName="vcpu-1"] SCSI DEVICE (scsi0:0): MODE SENSE(6) for unsupported page 0x8
2025-12-14T13:19:21.094Z -INFO vmware-vmx.exe 22116 [ws@4413 threadName="vcpu-1"] SOUNDLIB: Creating WAVE backend stream.
2025-12-14T13:19:21.097Z -INFO vmware-vmx.exe 22116 [ws@4413 threadName="vcpu-1"] SOUNDLIB: SoundWaveSelectHostDevice: Found device Headset Earphone (Logitech Mono
2025-12-14T13:19:21.168Z -INFO vmware-vmx.exe 22116 [ws@4413 threadName="vcpu-1"] SOUNDLIB: SoundWaveComputeBufferParams: Initializing 10 buffers of length 3840, capable of holding a total of 200000 usecs of sound.
2025-12-14T13:19:21.169Z -INFO vmware-vmx.exe 22116 [ws@4413 threadName="soundWavePlayback17"] VTHREAD 24448 "soundWavePlayback17"
2025-12-14T13:19:21.169Z -INFO vmware-vmx.exe 22116 [ws@4413 threadName="soundWavePlayback17"] SOUNDLIB: SoundWaveThread: Poll thread entered : id(24448)
2025-12-14T13:19:21.169Z -INFO vmware-vmx.exe 22116 [ws@4413 threadName="vcpu-1"] SOUNDLIB: SoundWaveCreateStream: Created poll thread : id(24448)
2025-12-14T13:19:21.180Z -INFO vmware-vmx.exe 22116 [ws@4413 threadName="vcpu-0"] SOUNDLIB: Starting WAVE stream 2200889C760.
2025-12-14T13:19:22.799Z -INFO vmware-vmx.exe 22116 [ws@4413 threadName="vmx"] SOUNDLIB: Stopping WAVE stream 2200889C760.
2025-12-14T13:19:22.810Z -INFO vmware-vmx.exe 22116 [ws@4413 threadName="soundWavePlayback17"] SOUNDLIB: SoundWavePoll: Poll invoked on a non-running stream; leaving early.
2025-12-14T13:19:22.811Z -INFO vmware-vmx.exe 22116 [ws@4413 threadName="vmx"] SOUNDLIB: Closing WAVE stream 2200889C760.
2025-12-14T13:19:22.811Z -INFO vmware-vmx.exe 22116 [ws@4413 threadName="vmx"] SOUNDLIB: SoundWaveCloseStream: Destroying poll thread : id(24448)
2025-12-14T13:19:22.811Z -INFO vmware-vmx.exe 22116 [ws@4413 threadName="soundWavePlayback17"] SOUNDLIB: SoundWaveThread: Poll thread exited : id(24448)
2025-12-14T13:20:51.006Z -INFO vmware-vmx.exe 22116 [ws@4413 threadName="vmx"] CPClipboard_SetItem: Set CPClipboard struct with data of size:80, format:1.
2025-12-14T13:20:51.006Z -INFO vmware-vmx.exe 22116 [ws@4413 threadName="vmx"] CPClipboard_SetItem: Set CPClipboard struct with data of size:41972, format:3.
2025-12-14T13:21:33.641Z -INFO vmware-vmx.exe 22116 [ws@4413 threadName="vmx"] USB: New set of 2 USB devices.
2025-12-14T13:21:33.641Z -INFO vmware-vmx.exe 22116 [ws@4413 threadName="vmx"] USB: Found device [name:Logitech\ Mono\ H650e vid:046d pid:0a47 path:1/0/9 speed:full family:audio,hid instanceId:USB\\VID_046D&PID_0A47\\00000000 serialnum:00000000 arbRuntimeKey:3 version:5]
2025-12-14T13:21:33.641Z -INFO vmware-vmx.exe 22116 [ws@4413 threadName="vmx"] USB: Found device [name:Yubico.com\ YubiKey\ OTP vid:1050 pid:0401 path:1/0/11 speed:full family:hid,hid-bootable instanceId:USB\\VID_0E0F&PID_0001\\5&1C5CE6EE&0&12 disconnected:1 arbRuntimeKey:6 quirks:allow version:5]
2025-12-14T13:21:33.936Z -INFO vmware-vmx.exe 22116 [ws@4413 threadName="vmx"] USB: New set of 2 USB devices.
2025-12-14T13:21:33.936Z -INFO vmware-vmx.exe 22116 [ws@4413 threadName="vmx"] USB: Found device [name:Logitech\ Mono\ H650e vid:046d pid:0a47 path:1/0/9 speed:full family:audio,hid instanceId:USB\\VID_046D&PID_0A47\\00000000 serialnum:00000000 arbRuntimeKey:3 version:5]
2025-12-14T13:21:33.937Z -INFO vmware-vmx.exe 22116 [ws@4413 threadName="vmx"] USB: Found device [name:Yubico.com\ YubiKey\ OTP vid:1050 pid:0401 path:1/0/11 speed:full family:hid,hid-bootable instanceId:USB\\VID_1050&PID_0401\\5&1C5CE6EE&0&12 arbRuntimeKey:6 quirks:allow version:5]
2025-12-14T13:25:08.354Z -INFO vmware-vmx.exe 22116 [ws@4413 threadName="vmx"] CPClipboard_SetItem: Set CPClipboard struct with data of size:3775, format:1.
2025-12-14T13:26:02.525Z -INFO vmware-vmx.exe 22116 [ws@4413 threadName="vmx"] CPClipboard_SetItem: Set CPClipboard struct with data of size:79, format:1.
2025-12-14T13:27:04.493Z -INFO vmware-vmx.exe 22116 [ws@4413 threadName="vmx"] CPClipboard_SetItem: Set CPClipboard struct with data of size:22, format:1.
2025-12-14T13:27:58.917Z -INFO vmware-vmx.exe 22116 [ws@4413 threadName="vmx"] CPClipboard_SetItem: Set CPClipboard struct with data of size:33, format:1.
2025-12-14T13:29:55.949Z -INFO vmware-vmx.exe 22116 [ws@4413 threadName="vmx"] CPClipboard_SetItem: Set CPClipboard struct with data of size:81, format:1.
2025-12-14T13:35:03.675Z -INFO vmware-vmx.exe 22116 [ws@4413 threadName="vmx"] CPClipboard_SetItem: Set CPClipboard struct with data of size:13, format:1.
2025-12-14T13:35:04.171Z -INFO vmware-vmx.exe 22116 [ws@4413 threadName="vmx"] MemSched: caller 0 numvm 1 locked pages: num 1424633 max 7264512
2025-12-14T13:35:04.171Z -INFO vmware-vmx.exe 22116 [ws@4413 threadName="vmx"] MemSched: locked Page Limit: host 7315831 config 7272704
2025-12-14T13:35:04.171Z -INFO vmware-vmx.exe 22116 [ws@4413 threadName="vmx"] MemSched: minmempct 50 timestamp 21815
2025-12-14T13:35:04.171Z -INFO vmware-vmx.exe 22116 [ws@4413 threadName="vmx"] MemSched: VM 0 min 799432 max 1585864 shares 1572864 paged 1330494 nonpaged 5264 anonymous 7736 locked 1424633 touchedPct 17 dirtiedPct 5 timestamp 21815 vmResponsive is 1
2025-12-14T13:35:04.171Z -INFO vmware-vmx.exe 22116 [ws@4413 threadName="vmx"] MemSched: locked 1424633 target 1585864 balloon 0 0 1022361 swapped 157060 0 allocd 5 512 state 0 100
2025-12-14T13:35:04.171Z -INFO vmware-vmx.exe 22116 [ws@4413 threadName="vmx"] MemSched: states: 0 16201 : 1 0 : 2 0 : 3 0
2025-12-14T13:35:04.171Z -INFO vmware-vmx.exe 22116 [ws@4413 threadName="vmx"] MemSched: Balloon enabled 1 guestType 4 maxSize 0
2025-12-14T13:37:26.960Z -INFO vmware-vmx.exe 22116 [ws@4413 threadName="vmx"] CPClipboard_SetItem: Set CPClipboard struct with data of size:97012, format:6.
2025-12-14T13:38:52.589Z -INFO vmware-vmx.exe 22116 [ws@4413 threadName="vmx"] CPClipboard_SetItem: Set CPClipboard struct with data of size:28, format:1.
2025-12-14T13:39:02.198Z -INFO vmware-vmx.exe 22116 [ws@4413 threadName="vcpu-0"] SOUNDLIB: Creating WAVE backend stream.
2025-12-14T13:39:02.201Z -INFO vmware-vmx.exe 22116 [ws@4413 threadName="vcpu-0"] SOUNDLIB: SoundWaveSelectHostDevice: Found device Headset Earphone (Logitech Mono
2025-12-14T13:39:02.262Z -INFO vmware-vmx.exe 22116 [ws@4413 threadName="vcpu-0"] SOUNDLIB: SoundWaveComputeBufferParams: Initializing 10 buffers of length 3840, capable of holding a total of 200000 usecs of sound.
2025-12-14T13:39:02.263Z -INFO vmware-vmx.exe 22116 [ws@4413 threadName="soundWavePlayback18"] VTHREAD 23932 "soundWavePlayback18"
2025-12-14T13:39:02.263Z -INFO vmware-vmx.exe 22116 [ws@4413 threadName="soundWavePlayback18"] SOUNDLIB: SoundWaveThread: Poll thread entered : id(23932)
2025-12-14T13:39:02.263Z -INFO vmware-vmx.exe 22116 [ws@4413 threadName="vcpu-0"] SOUNDLIB: SoundWaveCreateStream: Created poll thread : id(23932)
2025-12-14T13:39:02.274Z -INFO vmware-vmx.exe 22116 [ws@4413 threadName="vcpu-0"] SOUNDLIB: Starting WAVE stream 2200889AFA0.
2025-12-14T13:39:14.083Z -INFO vmware-vmx.exe 22116 [ws@4413 threadName="vcpu-0"] SOUNDLIB: Creating WAVE backend stream.
2025-12-14T13:39:14.085Z -INFO vmware-vmx.exe 22116 [ws@4413 threadName="vcpu-0"] SOUNDLIB: SoundWaveSelectHostDevice: Found device Headset Earphone (Logitech Mono
2025-12-14T13:39:14.099Z -INFO vmware-vmx.exe 22116 [ws@4413 threadName="vcpu-0"] SOUNDLIB: SoundWaveComputeBufferParams: Initializing 9 buffers of length 3584, capable of holding a total of 182857 usecs of sound.
2025-12-14T13:39:14.099Z -INFO vmware-vmx.exe 22116 [ws@4413 threadName="soundWaveRecord4"] VTHREAD 28020 "soundWaveRecord4"
2025-12-14T13:39:14.099Z -INFO vmware-vmx.exe 22116 [ws@4413 threadName="soundWaveRecord4"] SOUNDLIB: SoundWaveThread: Poll thread entered : id(28020)
2025-12-14T13:39:14.099Z -INFO vmware-vmx.exe 22116 [ws@4413 threadName="vcpu-0"] SOUNDLIB: SoundWaveCreateStream: Created poll thread : id(28020)
2025-12-14T13:39:14.099Z -INFO vmware-vmx.exe 22116 [ws@4413 threadName="vcpu-0"] SOUNDLIB: Starting WAVE stream 2200889C260.
2025-12-14T13:43:53.649Z -INFO vmware-vmx.exe 22116 [ws@4413 threadName="vcpu-0"] SCSI DEVICE (scsi0:0): MODE SENSE(6) for unsupported page 0x8
2025-12-14T13:43:53.649Z -INFO vmware-vmx.exe 22116 [ws@4413 threadName="vcpu-0"] SCSI DEVICE (scsi0:0): MODE SENSE(6) for unsupported page 0x8
2025-12-14T13:43:53.652Z -INFO vmware-vmx.exe 22116 [ws@4413 threadName="vcpu-1"] SCSI DEVICE (scsi0:0): MODE SENSE(6) for unsupported page 0x8
2025-12-14T13:43:53.652Z -INFO vmware-vmx.exe 22116 [ws@4413 threadName="vcpu-1"] SCSI DEVICE (scsi0:0): MODE SENSE(6) for unsupported page 0x8
2025-12-14T13:43:53.655Z -INFO vmware-vmx.exe 22116 [ws@4413 threadName="vcpu-0"] SCSI DEVICE (scsi0:0): MODE SENSE(6) for unsupported page 0x8
2025-12-14T13:43:53.655Z -INFO vmware-vmx.exe 22116 [ws@4413 threadName="vcpu-0"] SCSI DEVICE (scsi0:0): MODE SENSE(6) for unsupported page 0x8
2025-12-14T13:43:53.657Z -INFO vmware-vmx.exe 22116 [ws@4413 threadName="vcpu-1"] SCSI DEVICE (scsi0:0): MODE SENSE(6) for unsupported page 0x8
2025-12-14T13:43:53.657Z -INFO vmware-vmx.exe 22116 [ws@4413 threadName="vcpu-1"] SCSI DEVICE (scsi0:0): MODE SENSE(6) for unsupported page 0x8
2025-12-14T13:43:53.661Z -INFO vmware-vmx.exe 22116 [ws@4413 threadName="vcpu-0"] SCSI DEVICE (scsi0:0): MODE SENSE(6) for unsupported page 0x8
2025-12-14T13:43:53.661Z -INFO vmware-vmx.exe 22116 [ws@4413 threadName="vcpu-0"] SCSI DEVICE (scsi0:0): MODE SENSE(6) for unsupported page 0x8
2025-12-14T13:43:53.663Z -INFO vmware-vmx.exe 22116 [ws@4413 threadName="vcpu-1"] SCSI DEVICE (scsi0:0): MODE SENSE(6) for unsupported page 0x8
2025-12-14T13:43:53.663Z -INFO vmware-vmx.exe 22116 [ws@4413 threadName="vcpu-1"] SCSI DEVICE (scsi0:0): MODE SENSE(6) for unsupported page 0x8
2025-12-14T13:51:50.936Z -INFO vmware-vmx.exe 22116 [ws@4413 threadName="vcpu-0"] SOUNDLIB: Stopping WAVE stream 2200889C260.
2025-12-14T13:51:50.940Z -INFO vmware-vmx.exe 22116 [ws@4413 threadName="soundWaveRecord4"] SOUNDLIB: SoundWavePoll: Poll invoked on a non-running stream; leaving early.
2025-12-14T13:51:50.940Z -INFO vmware-vmx.exe 22116 [ws@4413 threadName="vcpu-0"] SOUNDLIB: Closing WAVE stream 2200889C260.
2025-12-14T13:51:50.940Z -INFO vmware-vmx.exe 22116 [ws@4413 threadName="vcpu-0"] SOUNDLIB: SoundWaveCloseStream: Destroying poll thread : id(28020)
2025-12-14T13:51:50.940Z -INFO vmware-vmx.exe 22116 [ws@4413 threadName="soundWaveRecord4"] SOUNDLIB: SoundWaveThread: Poll thread exited : id(28020)
2025-12-14T13:51:51.440Z -INFO vmware-vmx.exe 22116 [ws@4413 threadName="vmx"] SOUNDLIB: Stopping WAVE stream 2200889AFA0.
2025-12-14T13:51:51.451Z -INFO vmware-vmx.exe 22116 [ws@4413 threadName="soundWavePlayback18"] SOUNDLIB: SoundWavePoll: Poll invoked on a non-running stream; leaving early.
2025-12-14T13:51:51.452Z -INFO vmware-vmx.exe 22116 [ws@4413 threadName="vmx"] SOUNDLIB: Closing WAVE stream 2200889AFA0.
2025-12-14T13:51:51.452Z -INFO vmware-vmx.exe 22116 [ws@4413 threadName="vmx"] SOUNDLIB: SoundWaveCloseStream: Destroying poll thread : id(23932)
2025-12-14T13:51:51.452Z -INFO vmware-vmx.exe 22116 [ws@4413 threadName="soundWavePlayback18"] SOUNDLIB: SoundWaveThread: Poll thread exited : id(23932)
2025-12-14T13:52:23.230Z -INFO vmware-vmx.exe 22116 [ws@4413 threadName="vcpu-0"] SOUNDLIB: Creating WAVE backend stream.
2025-12-14T13:52:23.233Z -INFO vmware-vmx.exe 22116 [ws@4413 threadName="vcpu-0"] SOUNDLIB: SoundWaveSelectHostDevice: Found device Headset Earphone (Logitech Mono
2025-12-14T13:52:23.247Z -INFO vmware-vmx.exe 22116 [ws@4413 threadName="vcpu-0"] SOUNDLIB: SoundWaveComputeBufferParams: Initializing 9 buffers of length 3584, capable of holding a total of 182857 usecs of sound.
2025-12-14T13:52:23.248Z -INFO vmware-vmx.exe 22116 [ws@4413 threadName="soundWaveRecord5"] VTHREAD 26420 "soundWaveRecord5"
2025-12-14T13:52:23.248Z -INFO vmware-vmx.exe 22116 [ws@4413 threadName="soundWaveRecord5"] SOUNDLIB: SoundWaveThread: Poll thread entered : id(26420)
2025-12-14T13:52:23.248Z -INFO vmware-vmx.exe 22116 [ws@4413 threadName="vcpu-0"] SOUNDLIB: SoundWaveCreateStream: Created poll thread : id(26420)
2025-12-14T13:52:23.248Z -INFO vmware-vmx.exe 22116 [ws@4413 threadName="vcpu-0"] SOUNDLIB: Starting WAVE stream 2200889B860.
2025-12-14T13:52:23.278Z -INFO vmware-vmx.exe 22116 [ws@4413 threadName="vcpu-0"] SOUNDLIB: Creating WAVE backend stream.
2025-12-14T13:52:23.280Z -INFO vmware-vmx.exe 22116 [ws@4413 threadName="vcpu-0"] SOUNDLIB: SoundWaveSelectHostDevice: Found device Headset Earphone (Logitech Mono
2025-12-14T13:52:23.294Z -INFO vmware-vmx.exe 22116 [ws@4413 threadName="vcpu-0"] SOUNDLIB: SoundWaveComputeBufferParams: Initializing 10 buffers of length 3840, capable of holding a total of 200000 usecs of sound.
2025-12-14T13:52:23.294Z -INFO vmware-vmx.exe 22116 [ws@4413 threadName="soundWavePlayback19"] VTHREAD 24724 "soundWavePlayback19"
2025-12-14T13:52:23.294Z -INFO vmware-vmx.exe 22116 [ws@4413 threadName="soundWavePlayback19"] SOUNDLIB: SoundWaveThread: Poll thread entered : id(24724)
2025-12-14T13:52:23.295Z -INFO vmware-vmx.exe 22116 [ws@4413 threadName="vcpu-0"] SOUNDLIB: SoundWaveCreateStream: Created poll thread : id(24724)
2025-12-14T13:52:23.298Z -INFO vmware-vmx.exe 22116 [ws@4413 threadName="vcpu-0"] SOUNDLIB: Starting WAVE stream 2200889B720.
2025-12-14T13:52:37.037Z -INFO vmware-vmx.exe 22116 [ws@4413 threadName="vcpu-0"] SOUNDLIB: Stopping WAVE stream 2200889B860.
2025-12-14T13:52:37.045Z -INFO vmware-vmx.exe 22116 [ws@4413 threadName="soundWaveRecord5"] SOUNDLIB: SoundWavePoll: Poll invoked on a non-running stream; leaving early.
2025-12-14T13:52:37.047Z -INFO vmware-vmx.exe 22116 [ws@4413 threadName="vcpu-0"] SOUNDLIB: Closing WAVE stream 2200889B860.
2025-12-14T13:52:37.047Z -INFO vmware-vmx.exe 22116 [ws@4413 threadName="vcpu-0"] SOUNDLIB: SoundWaveCloseStream: Destroying poll thread : id(26420)
2025-12-14T13:52:37.047Z -INFO vmware-vmx.exe 22116 [ws@4413 threadName="soundWaveRecord5"] SOUNDLIB: SoundWaveThread: Poll thread exited : id(26420)
2025-12-14T13:52:37.525Z -INFO vmware-vmx.exe 22116 [ws@4413 threadName="vmx"] SOUNDLIB: Stopping WAVE stream 2200889B720.
2025-12-14T13:52:37.535Z -INFO vmware-vmx.exe 22116 [ws@4413 threadName="soundWavePlayback19"] SOUNDLIB: SoundWavePoll: Poll invoked on a non-running stream; leaving early.
2025-12-14T13:52:37.536Z -INFO vmware-vmx.exe 22116 [ws@4413 threadName="vmx"] SOUNDLIB: Closing WAVE stream 2200889B720.
2025-12-14T13:52:37.536Z -INFO vmware-vmx.exe 22116 [ws@4413 threadName="vmx"] SOUNDLIB: SoundWaveCloseStream: Destroying poll thread : id(24724)
2025-12-14T13:52:37.536Z -INFO vmware-vmx.exe 22116 [ws@4413 threadName="soundWavePlayback19"] SOUNDLIB: SoundWaveThread: Poll thread exited : id(24724)
2025-12-14T13:53:15.858Z -INFO vmware-vmx.exe 22116 [ws@4413 threadName="vcpu-1"] SOUNDLIB: Creating WAVE backend stream.
2025-12-14T13:53:15.860Z -INFO vmware-vmx.exe 22116 [ws@4413 threadName="vcpu-1"] SOUNDLIB: SoundWaveSelectHostDevice: Found device Headset Earphone (Logitech Mono
2025-12-14T13:53:15.881Z -INFO vmware-vmx.exe 22116 [ws@4413 threadName="vcpu-1"] SOUNDLIB: SoundWaveComputeBufferParams: Initializing 10 buffers of length 3840, capable of holding a total of 200000 usecs of sound.
2025-12-14T13:53:15.882Z -INFO vmware-vmx.exe 22116 [ws@4413 threadName="soundWavePlayback20"] VTHREAD 26164 "soundWavePlayback20"
2025-12-14T13:53:15.882Z -INFO vmware-vmx.exe 22116 [ws@4413 threadName="soundWavePlayback20"] SOUNDLIB: SoundWaveThread: Poll thread entered : id(26164)
2025-12-14T13:53:15.882Z -INFO vmware-vmx.exe 22116 [ws@4413 threadName="vcpu-1"] SOUNDLIB: SoundWaveCreateStream: Created poll thread : id(26164)
2025-12-14T13:53:15.892Z -INFO vmware-vmx.exe 22116 [ws@4413 threadName="vcpu-0"] SOUNDLIB: Starting WAVE stream 2200889BD60.
2025-12-14T13:53:18.888Z -INFO vmware-vmx.exe 22116 [ws@4413 threadName="vcpu-0"] SOUNDLIB: Creating WAVE backend stream.
2025-12-14T13:53:18.890Z -INFO vmware-vmx.exe 22116 [ws@4413 threadName="vcpu-0"] SOUNDLIB: SoundWaveSelectHostDevice: Found device Headset Earphone (Logitech Mono
2025-12-14T13:53:18.904Z -INFO vmware-vmx.exe 22116 [ws@4413 threadName="vcpu-0"] SOUNDLIB: SoundWaveComputeBufferParams: Initializing 9 buffers of length 3584, capable of holding a total of 182857 usecs of sound.
2025-12-14T13:53:18.905Z -INFO vmware-vmx.exe 22116 [ws@4413 threadName="soundWaveRecord6"] VTHREAD 17176 "soundWaveRecord6"
2025-12-14T13:53:18.905Z -INFO vmware-vmx.exe 22116 [ws@4413 threadName="soundWaveRecord6"] SOUNDLIB: SoundWaveThread: Poll thread entered : id(17176)
2025-12-14T13:53:18.905Z -INFO vmware-vmx.exe 22116 [ws@4413 threadName="vcpu-0"] SOUNDLIB: SoundWaveCreateStream: Created poll thread : id(17176)
2025-12-14T13:53:18.905Z -INFO vmware-vmx.exe 22116 [ws@4413 threadName="vcpu-0"] SOUNDLIB: Starting WAVE stream 2200889C4E0.
2025-12-14T14:05:04.256Z -INFO vmware-vmx.exe 22116 [ws@4413 threadName="vmx"] MemSched: caller 0 numvm 1 locked pages: num 1411834 max 7264512
2025-12-14T14:05:04.256Z -INFO vmware-vmx.exe 22116 [ws@4413 threadName="vmx"] MemSched: locked Page Limit: host 7326739 config 7272704
2025-12-14T14:05:04.256Z -INFO vmware-vmx.exe 22116 [ws@4413 threadName="vmx"] MemSched: minmempct 50 timestamp 23615
2025-12-14T14:05:04.256Z -INFO vmware-vmx.exe 22116 [ws@4413 threadName="vmx"] MemSched: VM 0 min 799432 max 1585864 shares 1572864 paged 1330494 nonpaged 5264 anonymous 7736 locked 1411834 touchedPct 17 dirtiedPct 3 timestamp 23615 vmResponsive is 1
2025-12-14T14:05:04.256Z -INFO vmware-vmx.exe 22116 [ws@4413 threadName="vmx"] MemSched: locked 1411834 target 1585864 balloon 0 0 1022361 swapped 169855 0 allocd 4 512 state 0 100
2025-12-14T14:05:04.256Z -INFO vmware-vmx.exe 22116 [ws@4413 threadName="vmx"] MemSched: states: 0 18001 : 1 0 : 2 0 : 3 0
2025-12-14T14:05:04.256Z -INFO vmware-vmx.exe 22116 [ws@4413 threadName="vmx"] MemSched: Balloon enabled 1 guestType 4 maxSize 0
2025-12-14T14:05:38.831Z -INFO vmware-vmx.exe 22116 [ws@4413 threadName="vmx"] DISKLIB-LIB : numIOs = 300000 numMergedIOs = 71951 numSplitIOs = 8605
2025-12-14T14:06:15.471Z -INFO vmware-vmx.exe 22116 [ws@4413 threadName="vcpu-0"] SCSI DEVICE (scsi0:0): MODE SENSE(6) for unsupported page 0x8
2025-12-14T14:06:15.471Z -INFO vmware-vmx.exe 22116 [ws@4413 threadName="vcpu-0"] SCSI DEVICE (scsi0:0): MODE SENSE(6) for unsupported page 0x8
2025-12-14T14:06:15.473Z -INFO vmware-vmx.exe 22116 [ws@4413 threadName="vcpu-1"] SCSI DEVICE (scsi0:0): MODE SENSE(6) for unsupported page 0x8
2025-12-14T14:06:15.473Z -INFO vmware-vmx.exe 22116 [ws@4413 threadName="vcpu-1"] SCSI DEVICE (scsi0:0): MODE SENSE(6) for unsupported page 0x8
2025-12-14T14:06:15.475Z -INFO vmware-vmx.exe 22116 [ws@4413 threadName="vcpu-1"] SCSI DEVICE (scsi0:0): MODE SENSE(6) for unsupported page 0x8
2025-12-14T14:06:15.475Z -INFO vmware-vmx.exe 22116 [ws@4413 threadName="vcpu-1"] SCSI DEVICE (scsi0:0): MODE SENSE(6) for unsupported page 0x8
2025-12-14T14:06:15.478Z -INFO vmware-vmx.exe 22116 [ws@4413 threadName="vcpu-0"] SCSI DEVICE (scsi0:0): MODE SENSE(6) for unsupported page 0x8
2025-12-14T14:06:15.478Z -INFO vmware-vmx.exe 22116 [ws@4413 threadName="vcpu-0"] SCSI DEVICE (scsi0:0): MODE SENSE(6) for unsupported page 0x8
2025-12-14T14:06:15.480Z -INFO vmware-vmx.exe 22116 [ws@4413 threadName="vcpu-0"] SCSI DEVICE (scsi0:0): MODE SENSE(6) for unsupported page 0x8
2025-12-14T14:06:15.480Z -INFO vmware-vmx.exe 22116 [ws@4413 threadName="vcpu-0"] SCSI DEVICE (scsi0:0): MODE SENSE(6) for unsupported page 0x8
2025-12-14T14:06:15.482Z -INFO vmware-vmx.exe 22116 [ws@4413 threadName="vcpu-1"] SCSI DEVICE (scsi0:0): MODE SENSE(6) for unsupported page 0x8
2025-12-14T14:06:15.482Z -INFO vmware-vmx.exe 22116 [ws@4413 threadName="vcpu-1"] SCSI DEVICE (scsi0:0): MODE SENSE(6) for unsupported page 0x8
2025-12-14T14:12:34.114Z -INFO vmware-vmx.exe 22116 [ws@4413 threadName="vcpu-1"] SOUNDLIB: Stopping WAVE stream 2200889C4E0.
2025-12-14T14:12:34.118Z -INFO vmware-vmx.exe 22116 [ws@4413 threadName="soundWaveRecord6"] SOUNDLIB: SoundWavePoll: Poll invoked on a non-running stream; leaving early.
2025-12-14T14:12:34.118Z -INFO vmware-vmx.exe 22116 [ws@4413 threadName="vcpu-1"] SOUNDLIB: Closing WAVE stream 2200889C4E0.
2025-12-14T14:12:34.118Z -INFO vmware-vmx.exe 22116 [ws@4413 threadName="vcpu-1"] SOUNDLIB: SoundWaveCloseStream: Destroying poll thread : id(17176)
2025-12-14T14:12:34.118Z -INFO vmware-vmx.exe 22116 [ws@4413 threadName="soundWaveRecord6"] SOUNDLIB: SoundWaveThread: Poll thread exited : id(17176)
2025-12-14T14:12:34.587Z -INFO vmware-vmx.exe 22116 [ws@4413 threadName="vmx"] SOUNDLIB: Stopping WAVE stream 2200889BD60.
2025-12-14T14:12:34.597Z -INFO vmware-vmx.exe 22116 [ws@4413 threadName="soundWavePlayback20"] SOUNDLIB: SoundWavePoll: Poll invoked on a non-running stream; leaving early.
2025-12-14T14:12:34.598Z -INFO vmware-vmx.exe 22116 [ws@4413 threadName="vmx"] SOUNDLIB: Closing WAVE stream 2200889BD60.
2025-12-14T14:12:34.598Z -INFO vmware-vmx.exe 22116 [ws@4413 threadName="vmx"] SOUNDLIB: SoundWaveCloseStream: Destroying poll thread : id(26164)
2025-12-14T14:12:34.598Z -INFO vmware-vmx.exe 22116 [ws@4413 threadName="soundWavePlayback20"] SOUNDLIB: SoundWaveThread: Poll thread exited : id(26164)
2025-12-14T14:18:13.105Z -INFO vmware-vmx.exe 22116 [ws@4413 threadName="vmx"] CPClipboard_SetItem: Set CPClipboard struct with data of size:260379, format:6.
2025-12-14T14:19:01.471Z -INFO vmware-vmx.exe 22116 [ws@4413 threadName="vmx"] CPClipboard_SetItem: Set CPClipboard struct with data of size:260379, format:6.
2025-12-14T14:19:51.006Z -INFO vmware-vmx.exe 22116 [ws@4413 threadName="vmx"] CPClipboard_SetItem: Set CPClipboard struct with data of size:306208, format:6.
2025-12-14T14:20:09.586Z -INFO vmware-vmx.exe 22116 [ws@4413 threadName="vmx"] CPClipboard_SetItem: Set CPClipboard struct with data of size:306208, format:6.
2025-12-14T14:20:14.200Z -INFO vmware-vmx.exe 22116 [ws@4413 threadName="vmx"] CPClipboard_SetItem: Set CPClipboard struct with data of size:138683, format:6.
2025-12-14T14:22:17.738Z -INFO vmware-vmx.exe 22116 [ws@4413 threadName="vmx"] CPClipboard_SetItem: Set CPClipboard struct with data of size:138683, format:6.
2025-12-14T14:22:27.251Z -INFO vmware-vmx.exe 22116 [ws@4413 threadName="vmx"] CPClipboard_SetItem: Set CPClipboard struct with data of size:848, format:1.
2025-12-14T14:22:27.251Z -INFO vmware-vmx.exe 22116 [ws@4413 threadName="vmx"] CPClipboard_SetItem: Set CPClipboard struct with data of size:49081, format:3.
2025-12-14T14:25:30.418Z -INFO vmware-vmx.exe 22116 [ws@4413 threadName="vmx"] CPClipboard_SetItem: Set CPClipboard struct with data of size:848, format:1.
2025-12-14T14:25:30.418Z -INFO vmware-vmx.exe 22116 [ws@4413 threadName="vmx"] CPClipboard_SetItem: Set CPClipboard struct with data of size:49083, format:3.
2025-12-14T14:28:00.768Z -INFO vmware-vmx.exe 22116 [ws@4413 threadName="vmx"] CPClipboard_SetItem: Set CPClipboard struct with data of size:1951875, format:6.
2025-12-14T14:29:11.973Z -INFO vmware-vmx.exe 22116 [ws@4413 threadName="vmx"] CPClipboard_SetItem: Set CPClipboard struct with data of size:687988, format:6.
2025-12-14T14:30:20.321Z -INFO vmware-vmx.exe 22116 [ws@4413 threadName="vmx"] CPClipboard_SetItem: Set CPClipboard struct with data of size:81, format:1.
2025-12-14T14:32:58.225Z -INFO vmware-vmx.exe 22116 [ws@4413 threadName="vmx"] CPClipboard_SetItem: Set CPClipboard struct with data of size:47, format:1.
2025-12-14T14:35:04.596Z -INFO vmware-vmx.exe 22116 [ws@4413 threadName="vmx"] MemSched: caller 0 numvm 1 locked pages: num 1403961 max 7235276
2025-12-14T14:35:04.596Z -INFO vmware-vmx.exe 22116 [ws@4413 threadName="vmx"] MemSched: locked Page Limit: host 7243468 config 7272704
2025-12-14T14:35:04.596Z -INFO vmware-vmx.exe 22116 [ws@4413 threadName="vmx"] MemSched: minmempct 50 timestamp 25415
2025-12-14T14:35:04.596Z -INFO vmware-vmx.exe 22116 [ws@4413 threadName="vmx"] MemSched: VM 0 min 799432 max 1585864 shares 1572864 paged 1330494 nonpaged 5264 anonymous 7736 locked 1403961 touchedPct 17 dirtiedPct 7 timestamp 25415 vmResponsive is 1
2025-12-14T14:35:04.596Z -INFO vmware-vmx.exe 22116 [ws@4413 threadName="vmx"] MemSched: locked 1403961 target 1585864 balloon 0 0 1022361 swapped 177825 0 allocd 0 512 state 0 100
2025-12-14T14:35:04.596Z -INFO vmware-vmx.exe 22116 [ws@4413 threadName="vmx"] MemSched: states: 0 19801 : 1 0 : 2 0 : 3 0
2025-12-14T14:35:04.596Z -INFO vmware-vmx.exe 22116 [ws@4413 threadName="vmx"] MemSched: Balloon enabled 1 guestType 4 maxSize 0
2025-12-14T14:35:52.193Z -INFO vmware-vmx.exe 22116 [ws@4413 threadName="vmx"] CPClipboard_SetItem: Set CPClipboard struct with data of size:250286, format:6.
2025-12-14T14:41:11.690Z -INFO vmware-vmx.exe 22116 [ws@4413 threadName="vcpu-0"] SCSI DEVICE (scsi0:0): MODE SENSE(6) for unsupported page 0x8
2025-12-14T14:41:11.690Z -INFO vmware-vmx.exe 22116 [ws@4413 threadName="vcpu-0"] SCSI DEVICE (scsi0:0): MODE SENSE(6) for unsupported page 0x8
2025-12-14T14:41:11.692Z -INFO vmware-vmx.exe 22116 [ws@4413 threadName="vcpu-0"] SCSI DEVICE (scsi0:0): MODE SENSE(6) for unsupported page 0x8
2025-12-14T14:41:11.692Z -INFO vmware-vmx.exe 22116 [ws@4413 threadName="vcpu-0"] SCSI DEVICE (scsi0:0): MODE SENSE(6) for unsupported page 0x8
2025-12-14T14:41:11.695Z -INFO vmware-vmx.exe 22116 [ws@4413 threadName="vcpu-0"] SCSI DEVICE (scsi0:0): MODE SENSE(6) for unsupported page 0x8
2025-12-14T14:41:11.695Z -INFO vmware-vmx.exe 22116 [ws@4413 threadName="vcpu-0"] SCSI DEVICE (scsi0:0): MODE SENSE(6) for unsupported page 0x8
2025-12-14T14:41:11.698Z -INFO vmware-vmx.exe 22116 [ws@4413 threadName="vcpu-1"] SCSI DEVICE (scsi0:0): MODE SENSE(6) for unsupported page 0x8
2025-12-14T14:41:11.698Z -INFO vmware-vmx.exe 22116 [ws@4413 threadName="vcpu-1"] SCSI DEVICE (scsi0:0): MODE SENSE(6) for unsupported page 0x8
2025-12-14T14:41:11.702Z -INFO vmware-vmx.exe 22116 [ws@4413 threadName="vcpu-1"] SCSI DEVICE (scsi0:0): MODE SENSE(6) for unsupported page 0x8
2025-12-14T14:41:11.702Z -INFO vmware-vmx.exe 22116 [ws@4413 threadName="vcpu-1"] SCSI DEVICE (scsi0:0): MODE SENSE(6) for unsupported page 0x8
2025-12-14T14:41:11.705Z -INFO vmware-vmx.exe 22116 [ws@4413 threadName="vcpu-1"] SCSI DEVICE (scsi0:0): MODE SENSE(6) for unsupported page 0x8
2025-12-14T14:41:11.705Z -INFO vmware-vmx.exe 22116 [ws@4413 threadName="vcpu-1"] SCSI DEVICE (scsi0:0): MODE SENSE(6) for unsupported page 0x8
2025-12-14T14:48:28.723Z -INFO vmware-vmx.exe 22116 [ws@4413 threadName="vmx"] CPClipboard_SetItem: Set CPClipboard struct with data of size:259614, format:6.
2025-12-14T14:49:03.815Z -INFO vmware-vmx.exe 22116 [ws@4413 threadName="vmx"] CPClipboard_SetItem: Set CPClipboard struct with data of size:259614, format:6.
2025-12-14T14:50:47.743Z -INFO vmware-vmx.exe 22116 [ws@4413 threadName="vmx"] CPClipboard_SetItem: Set CPClipboard struct with data of size:185, format:1.
2025-12-14T14:52:26.971Z -INFO vmware-vmx.exe 22116 [ws@4413 threadName="vmx"] CPClipboard_SetItem: Set CPClipboard struct with data of size:582455, format:6.
2025-12-14T14:56:53.797Z -INFO vmware-vmx.exe 22116 [ws@4413 threadName="vcpu-0"] SCSI DEVICE (scsi0:0): MODE SENSE(6) for unsupported page 0x8
2025-12-14T14:56:53.797Z -INFO vmware-vmx.exe 22116 [ws@4413 threadName="vcpu-0"] SCSI DEVICE (scsi0:0): MODE SENSE(6) for unsupported page 0x8
2025-12-14T14:56:53.800Z -INFO vmware-vmx.exe 22116 [ws@4413 threadName="vcpu-1"] SCSI DEVICE (scsi0:0): MODE SENSE(6) for unsupported page 0x8
2025-12-14T14:56:53.800Z -INFO vmware-vmx.exe 22116 [ws@4413 threadName="vcpu-1"] SCSI DEVICE (scsi0:0): MODE SENSE(6) for unsupported page 0x8
2025-12-14T14:56:53.803Z -INFO vmware-vmx.exe 22116 [ws@4413 threadName="vcpu-1"] SCSI DEVICE (scsi0:0): MODE SENSE(6) for unsupported page 0x8
2025-12-14T14:56:53.803Z -INFO vmware-vmx.exe 22116 [ws@4413 threadName="vcpu-1"] SCSI DEVICE (scsi0:0): MODE SENSE(6) for unsupported page 0x8
2025-12-14T14:56:53.805Z -INFO vmware-vmx.exe 22116 [ws@4413 threadName="vcpu-1"] SCSI DEVICE (scsi0:0): MODE SENSE(6) for unsupported page 0x8
2025-12-14T14:56:53.806Z -INFO vmware-vmx.exe 22116 [ws@4413 threadName="vcpu-1"] SCSI DEVICE (scsi0:0): MODE SENSE(6) for unsupported page 0x8
2025-12-14T14:56:53.808Z -INFO vmware-vmx.exe 22116 [ws@4413 threadName="vcpu-0"] SCSI DEVICE (scsi0:0): MODE SENSE(6) for unsupported page 0x8
2025-12-14T14:56:53.808Z -INFO vmware-vmx.exe 22116 [ws@4413 threadName="vcpu-0"] SCSI DEVICE (scsi0:0): MODE SENSE(6) for unsupported page 0x8
2025-12-14T14:56:53.810Z -INFO vmware-vmx.exe 22116 [ws@4413 threadName="vcpu-1"] SCSI DEVICE (scsi0:0): MODE SENSE(6) for unsupported page 0x8
2025-12-14T14:56:53.810Z -INFO vmware-vmx.exe 22116 [ws@4413 threadName="vcpu-1"] SCSI DEVICE (scsi0:0): MODE SENSE(6) for unsupported page 0x8
2025-12-14T15:05:05.255Z -INFO vmware-vmx.exe 22116 [ws@4413 threadName="vmx"] MemSched: caller 0 numvm 1 locked pages: num 1391413 max 7181263
2025-12-14T15:05:05.255Z -INFO vmware-vmx.exe 22116 [ws@4413 threadName="vmx"] MemSched: locked Page Limit: host 7189455 config 7272704
2025-12-14T15:05:05.255Z -INFO vmware-vmx.exe 22116 [ws@4413 threadName="vmx"] MemSched: minmempct 50 timestamp 27216
2025-12-14T15:05:05.255Z -INFO vmware-vmx.exe 22116 [ws@4413 threadName="vmx"] MemSched: VM 0 min 799432 max 1585864 shares 1572864 paged 1330494 nonpaged 5264 anonymous 7736 locked 1391413 touchedPct 15 dirtiedPct 4 timestamp 27216 vmResponsive is 1
2025-12-14T15:05:05.255Z -INFO vmware-vmx.exe 22116 [ws@4413 threadName="vmx"] MemSched: locked 1391413 target 1585864 balloon 0 0 1022361 swapped 190391 0 allocd 0 512 state 0 100
2025-12-14T15:05:05.255Z -INFO vmware-vmx.exe 22116 [ws@4413 threadName="vmx"] MemSched: states: 0 21601 : 1 0 : 2 0 : 3 0
2025-12-14T15:05:05.255Z -INFO vmware-vmx.exe 22116 [ws@4413 threadName="vmx"] MemSched: Balloon enabled 1 guestType 4 maxSize 0
2025-12-14T15:08:53.929Z -INFO vmware-vmx.exe 22116 [ws@4413 threadName="vcpu-0"] DISKUTIL: scsi0:0 : capacity=83886080 logical sector size=512
2025-12-14T15:13:02.320Z -INFO vmware-vmx.exe 22116 [ws@4413 threadName="vcpu-0"] SCSI DEVICE (scsi0:0): MODE SENSE(6) for unsupported page 0x8
2025-12-14T15:13:02.320Z -INFO vmware-vmx.exe 22116 [ws@4413 threadName="vcpu-0"] SCSI DEVICE (scsi0:0): MODE SENSE(6) for unsupported page 0x8
2025-12-14T15:13:02.322Z -INFO vmware-vmx.exe 22116 [ws@4413 threadName="vcpu-1"] SCSI DEVICE (scsi0:0): MODE SENSE(6) for unsupported page 0x8
2025-12-14T15:13:02.322Z -INFO vmware-vmx.exe 22116 [ws@4413 threadName="vcpu-1"] SCSI DEVICE (scsi0:0): MODE SENSE(6) for unsupported page 0x8
2025-12-14T15:13:02.325Z -INFO vmware-vmx.exe 22116 [ws@4413 threadName="vcpu-1"] SCSI DEVICE (scsi0:0): MODE SENSE(6) for unsupported page 0x8
2025-12-14T15:13:02.325Z -INFO vmware-vmx.exe 22116 [ws@4413 threadName="vcpu-0"] SCSI DEVICE (scsi0:0): MODE SENSE(6) for unsupported page 0x8
2025-12-14T15:13:02.327Z -INFO vmware-vmx.exe 22116 [ws@4413 threadName="vcpu-0"] SCSI DEVICE (scsi0:0): MODE SENSE(6) for unsupported page 0x8
2025-12-14T15:13:02.327Z -INFO vmware-vmx.exe 22116 [ws@4413 threadName="vcpu-0"] SCSI DEVICE (scsi0:0): MODE SENSE(6) for unsupported page 0x8
2025-12-14T15:13:02.329Z -INFO vmware-vmx.exe 22116 [ws@4413 threadName="vcpu-0"] SCSI DEVICE (scsi0:0): MODE SENSE(6) for unsupported page 0x8
2025-12-14T15:13:02.329Z -INFO vmware-vmx.exe 22116 [ws@4413 threadName="vcpu-0"] SCSI DEVICE (scsi0:0): MODE SENSE(6) for unsupported page 0x8
2025-12-14T15:13:02.330Z -INFO vmware-vmx.exe 22116 [ws@4413 threadName="vcpu-0"] SCSI DEVICE (scsi0:0): MODE SENSE(6) for unsupported page 0x8
2025-12-14T15:13:02.330Z -INFO vmware-vmx.exe 22116 [ws@4413 threadName="vcpu-0"] SCSI DEVICE (scsi0:0): MODE SENSE(6) for unsupported page 0x8
2025-12-14T15:17:37.643Z -INFO vmware-vmx.exe 22116 [ws@4413 threadName="vmx"] CPClipboard_SetItem: Set CPClipboard struct with data of size:23, format:1.
2025-12-14T15:33:18.485Z -INFO vmware-vmx.exe 22116 [ws@4413 threadName="vcpu-1"] SCSI DEVICE (scsi0:0): MODE SENSE(6) for unsupported page 0x8
2025-12-14T15:33:18.485Z -INFO vmware-vmx.exe 22116 [ws@4413 threadName="vcpu-1"] SCSI DEVICE (scsi0:0): MODE SENSE(6) for unsupported page 0x8
2025-12-14T15:33:18.487Z -INFO vmware-vmx.exe 22116 [ws@4413 threadName="vcpu-1"] SCSI DEVICE (scsi0:0): MODE SENSE(6) for unsupported page 0x8
2025-12-14T15:33:18.487Z -INFO vmware-vmx.exe 22116 [ws@4413 threadName="vcpu-1"] SCSI DEVICE (scsi0:0): MODE SENSE(6) for unsupported page 0x8
2025-12-14T15:33:18.489Z -INFO vmware-vmx.exe 22116 [ws@4413 threadName="vcpu-1"] SCSI DEVICE (scsi0:0): MODE SENSE(6) for unsupported page 0x8
2025-12-14T15:33:18.490Z -INFO vmware-vmx.exe 22116 [ws@4413 threadName="vcpu-1"] SCSI DEVICE (scsi0:0): MODE SENSE(6) for unsupported page 0x8
2025-12-14T15:33:18.491Z -INFO vmware-vmx.exe 22116 [ws@4413 threadName="vcpu-0"] SCSI DEVICE (scsi0:0): MODE SENSE(6) for unsupported page 0x8
2025-12-14T15:33:18.491Z -INFO vmware-vmx.exe 22116 [ws@4413 threadName="vcpu-0"] SCSI DEVICE (scsi0:0): MODE SENSE(6) for unsupported page 0x8
2025-12-14T15:33:18.493Z -INFO vmware-vmx.exe 22116 [ws@4413 threadName="vcpu-1"] SCSI DEVICE (scsi0:0): MODE SENSE(6) for unsupported page 0x8
2025-12-14T15:33:18.493Z -INFO vmware-vmx.exe 22116 [ws@4413 threadName="vcpu-1"] SCSI DEVICE (scsi0:0): MODE SENSE(6) for unsupported page 0x8
2025-12-14T15:33:18.497Z -INFO vmware-vmx.exe 22116 [ws@4413 threadName="vcpu-0"] SCSI DEVICE (scsi0:0): MODE SENSE(6) for unsupported page 0x8
2025-12-14T15:33:18.498Z -INFO vmware-vmx.exe 22116 [ws@4413 threadName="vcpu-0"] SCSI DEVICE (scsi0:0): MODE SENSE(6) for unsupported page 0x8
2025-12-14T15:33:20.166Z -INFO vmware-vmx.exe 22116 [ws@4413 threadName="vcpu-1"] SCSI DEVICE (scsi0:0): MODE SENSE(6) for unsupported page 0x8
2025-12-14T15:33:20.166Z -INFO vmware-vmx.exe 22116 [ws@4413 threadName="vcpu-1"] SCSI DEVICE (scsi0:0): MODE SENSE(6) for unsupported page 0x8
2025-12-14T15:33:20.177Z -INFO vmware-vmx.exe 22116 [ws@4413 threadName="vcpu-0"] SCSI DEVICE (scsi0:0): MODE SENSE(6) for unsupported page 0x8
2025-12-14T15:33:20.177Z -INFO vmware-vmx.exe 22116 [ws@4413 threadName="vcpu-1"] SCSI DEVICE (scsi0:0): MODE SENSE(6) for unsupported page 0x8
2025-12-14T15:33:20.187Z -INFO vmware-vmx.exe 22116 [ws@4413 threadName="vcpu-1"] SCSI DEVICE (scsi0:0): MODE SENSE(6) for unsupported page 0x8
2025-12-14T15:33:20.187Z -INFO vmware-vmx.exe 22116 [ws@4413 threadName="vcpu-0"] SCSI DEVICE (scsi0:0): MODE SENSE(6) for unsupported page 0x8
2025-12-14T15:33:20.191Z -INFO vmware-vmx.exe 22116 [ws@4413 threadName="vcpu-0"] SCSI DEVICE (scsi0:0): MODE SENSE(6) for unsupported page 0x8
2025-12-14T15:33:20.191Z -INFO vmware-vmx.exe 22116 [ws@4413 threadName="vcpu-1"] SCSI DEVICE (scsi0:0): MODE SENSE(6) for unsupported page 0x8
2025-12-14T15:33:20.194Z -INFO vmware-vmx.exe 22116 [ws@4413 threadName="vcpu-0"] SCSI DEVICE (scsi0:0): MODE SENSE(6) for unsupported page 0x8
2025-12-14T15:33:20.194Z -INFO vmware-vmx.exe 22116 [ws@4413 threadName="vcpu-0"] SCSI DEVICE (scsi0:0): MODE SENSE(6) for unsupported page 0x8
2025-12-14T15:33:20.247Z -INFO vmware-vmx.exe 22116 [ws@4413 threadName="vcpu-0"] SCSI DEVICE (scsi0:0): MODE SENSE(6) for unsupported page 0x8
2025-12-14T15:33:20.248Z -INFO vmware-vmx.exe 22116 [ws@4413 threadName="vcpu-1"] SCSI DEVICE (scsi0:0): MODE SENSE(6) for unsupported page 0x8
2025-12-14T15:33:20.253Z -INFO vmware-vmx.exe 22116 [ws@4413 threadName="vcpu-0"] SCSI DEVICE (scsi0:0): MODE SENSE(6) for unsupported page 0x8
2025-12-14T15:33:20.253Z -INFO vmware-vmx.exe 22116 [ws@4413 threadName="vcpu-1"] SCSI DEVICE (scsi0:0): MODE SENSE(6) for unsupported page 0x8
2025-12-14T15:33:20.255Z -INFO vmware-vmx.exe 22116 [ws@4413 threadName="vcpu-1"] SCSI DEVICE (scsi0:0): MODE SENSE(6) for unsupported page 0x8
2025-12-14T15:33:20.255Z -INFO vmware-vmx.exe 22116 [ws@4413 threadName="vcpu-1"] SCSI DEVICE (scsi0:0): MODE SENSE(6) for unsupported page 0x8
2025-12-14T15:33:21.964Z -INFO vmware-vmx.exe 22116 [ws@4413 threadName="vcpu-0"] DISKUTIL: scsi0:0 : capacity=83886080 logical sector size=512
2025-12-14T15:33:22.286Z -INFO vmware-vmx.exe 22116 [ws@4413 threadName="vcpu-1"] DISKUTIL: scsi0:0 : capacity=83886080 logical sector size=512
2025-12-14T15:33:22.425Z -INFO vmware-vmx.exe 22116 [ws@4413 threadName="vcpu-0"] DISKUTIL: scsi0:0 : capacity=83886080 logical sector size=512
2025-12-14T15:33:22.558Z -INFO vmware-vmx.exe 22116 [ws@4413 threadName="vcpu-1"] DISKUTIL: scsi0:0 : capacity=83886080 logical sector size=512
2025-12-14T15:33:23.328Z -INFO vmware-vmx.exe 22116 [ws@4413 threadName="vcpu-1"] DISKUTIL: scsi0:0 : capacity=83886080 logical sector size=512
2025-12-14T15:33:23.328Z -INFO vmware-vmx.exe 22116 [ws@4413 threadName="vcpu-1"] DISKUTIL: scsi0:0 : capacity=83886080 logical sector size=512
2025-12-14T15:33:36.707Z -INFO vmware-vmx.exe 22116 [ws@4413 threadName="vcpu-1"] SCSI DEVICE (scsi0:0): MODE SENSE(6) for unsupported page 0x8
2025-12-14T15:33:36.707Z -INFO vmware-vmx.exe 22116 [ws@4413 threadName="vcpu-1"] SCSI DEVICE (scsi0:0): MODE SENSE(6) for unsupported page 0x8
2025-12-14T15:33:36.708Z -INFO vmware-vmx.exe 22116 [ws@4413 threadName="vcpu-1"] DISKUTIL: scsi0:0 : capacity=83886080 logical sector size=512
2025-12-14T15:33:36.714Z -INFO vmware-vmx.exe 22116 [ws@4413 threadName="vcpu-1"] CDROM: Emulate GET CONFIGURATION RT 0 starting feature 0
2025-12-14T15:33:37.091Z -INFO vmware-vmx.exe 22116 [ws@4413 threadName="vmx"] CPClipboard_SetItem: Set CPClipboard struct with data of size:1622072, format:6.
2025-12-14T15:35:05.833Z -INFO vmware-vmx.exe 22116 [ws@4413 threadName="vmx"] MemSched: caller 0 numvm 1 locked pages: num 1384339 max 7200077
2025-12-14T15:35:05.833Z -INFO vmware-vmx.exe 22116 [ws@4413 threadName="vmx"] MemSched: locked Page Limit: host 7208269 config 7272704
2025-12-14T15:35:05.833Z -INFO vmware-vmx.exe 22116 [ws@4413 threadName="vmx"] MemSched: minmempct 50 timestamp 29016
2025-12-14T15:35:05.833Z -INFO vmware-vmx.exe 22116 [ws@4413 threadName="vmx"] MemSched: VM 0 min 799432 max 1585864 shares 1572864 paged 1330494 nonpaged 5264 anonymous 7736 locked 1384339 touchedPct 20 dirtiedPct 4 timestamp 29016 vmResponsive is 1
2025-12-14T15:35:05.833Z -INFO vmware-vmx.exe 22116 [ws@4413 threadName="vmx"] MemSched: locked 1384339 target 1585864 balloon 0 0 1022361 swapped 197434 0 allocd 4 512 state 0 100
2025-12-14T15:35:05.833Z -INFO vmware-vmx.exe 22116 [ws@4413 threadName="vmx"] MemSched: states: 0 23401 : 1 0 : 2 0 : 3 0
2025-12-14T15:35:05.833Z -INFO vmware-vmx.exe 22116 [ws@4413 threadName="vmx"] MemSched: Balloon enabled 1 guestType 4 maxSize 0
2025-12-14T15:37:24.273Z -INFO vmware-vmx.exe 22116 [ws@4413 threadName="vmx"] CPClipboard_SetItem: Set CPClipboard struct with data of size:2602870, format:6.
2025-12-14T15:39:07.252Z -INFO vmware-vmx.exe 22116 [ws@4413 threadName="vmx"] CPClipboard_SetItem: Set CPClipboard struct with data of size:220746, format:6.
2025-12-14T15:39:37.176Z -INFO vmware-vmx.exe 22116 [ws@4413 threadName="vmx"] CPClipboard_SetItem: Set CPClipboard struct with data of size:47, format:1.
2025-12-14T15:45:04.833Z -INFO vmware-vmx.exe 22116 [ws@4413 threadName="vcpu-0"] SCSI DEVICE (scsi0:0): MODE SENSE(6) for unsupported page 0x8
2025-12-14T15:45:04.833Z -INFO vmware-vmx.exe 22116 [ws@4413 threadName="vcpu-0"] SCSI DEVICE (scsi0:0): MODE SENSE(6) for unsupported page 0x8
2025-12-14T15:45:04.835Z -INFO vmware-vmx.exe 22116 [ws@4413 threadName="vcpu-1"] SCSI DEVICE (scsi0:0): MODE SENSE(6) for unsupported page 0x8
2025-12-14T15:45:04.835Z -INFO vmware-vmx.exe 22116 [ws@4413 threadName="vcpu-1"] SCSI DEVICE (scsi0:0): MODE SENSE(6) for unsupported page 0x8
2025-12-14T15:45:04.838Z -INFO vmware-vmx.exe 22116 [ws@4413 threadName="vcpu-0"] SCSI DEVICE (scsi0:0): MODE SENSE(6) for unsupported page 0x8
2025-12-14T15:45:04.838Z -INFO vmware-vmx.exe 22116 [ws@4413 threadName="vcpu-0"] SCSI DEVICE (scsi0:0): MODE SENSE(6) for unsupported page 0x8
2025-12-14T15:45:04.839Z -INFO vmware-vmx.exe 22116 [ws@4413 threadName="vcpu-0"] SCSI DEVICE (scsi0:0): MODE SENSE(6) for unsupported page 0x8
2025-12-14T15:45:04.839Z -INFO vmware-vmx.exe 22116 [ws@4413 threadName="vcpu-0"] SCSI DEVICE (scsi0:0): MODE SENSE(6) for unsupported page 0x8
2025-12-14T15:45:04.841Z -INFO vmware-vmx.exe 22116 [ws@4413 threadName="vcpu-1"] SCSI DEVICE (scsi0:0): MODE SENSE(6) for unsupported page 0x8
2025-12-14T15:45:04.841Z -INFO vmware-vmx.exe 22116 [ws@4413 threadName="vcpu-1"] SCSI DEVICE (scsi0:0): MODE SENSE(6) for unsupported page 0x8
2025-12-14T15:45:04.843Z -INFO vmware-vmx.exe 22116 [ws@4413 threadName="vcpu-0"] SCSI DEVICE (scsi0:0): MODE SENSE(6) for unsupported page 0x8
2025-12-14T15:45:04.843Z -INFO vmware-vmx.exe 22116 [ws@4413 threadName="vcpu-0"] SCSI DEVICE (scsi0:0): MODE SENSE(6) for unsupported page 0x8
2025-12-14T15:45:18.969Z -INFO vmware-vmx.exe 22116 [ws@4413 threadName="vcpu-1"] SCSI DEVICE (scsi0:0): MODE SENSE(6) for unsupported page 0x8
2025-12-14T15:45:18.970Z -INFO vmware-vmx.exe 22116 [ws@4413 threadName="vcpu-1"] SCSI DEVICE (scsi0:0): MODE SENSE(6) for unsupported page 0x8
2025-12-14T15:45:18.970Z -INFO vmware-vmx.exe 22116 [ws@4413 threadName="vcpu-1"] DISKUTIL: scsi0:0 : capacity=83886080 logical sector size=512
2025-12-14T15:45:18.976Z -INFO vmware-vmx.exe 22116 [ws@4413 threadName="vcpu-1"] CDROM: Emulate GET CONFIGURATION RT 0 starting feature 0
2025-12-14T15:54:14.991Z -INFO vmware-vmx.exe 22116 [ws@4413 threadName="vmx"] CPClipboard_SetItem: Set CPClipboard struct with data of size:222990, format:6.
2025-12-14T15:59:13.792Z -INFO vmware-vmx.exe 22116 [ws@4413 threadName="vmx"] DISKLIB-LIB : numIOs = 350000 numMergedIOs = 75524 numSplitIOs = 8897
2025-12-14T16:05:03.416Z -INFO vmware-vmx.exe 22116 [ws@4413 threadName="vcpu-1"] SCSI DEVICE (scsi0:0): MODE SENSE(6) for unsupported page 0x8
2025-12-14T16:05:03.416Z -INFO vmware-vmx.exe 22116 [ws@4413 threadName="vcpu-1"] SCSI DEVICE (scsi0:0): MODE SENSE(6) for unsupported page 0x8
2025-12-14T16:05:03.418Z -INFO vmware-vmx.exe 22116 [ws@4413 threadName="vcpu-1"] SCSI DEVICE (scsi0:0): MODE SENSE(6) for unsupported page 0x8
2025-12-14T16:05:03.418Z -INFO vmware-vmx.exe 22116 [ws@4413 threadName="vcpu-1"] SCSI DEVICE (scsi0:0): MODE SENSE(6) for unsupported page 0x8
2025-12-14T16:05:03.420Z -INFO vmware-vmx.exe 22116 [ws@4413 threadName="vcpu-1"] SCSI DEVICE (scsi0:0): MODE SENSE(6) for unsupported page 0x8
2025-12-14T16:05:03.420Z -INFO vmware-vmx.exe 22116 [ws@4413 threadName="vcpu-1"] SCSI DEVICE (scsi0:0): MODE SENSE(6) for unsupported page 0x8
2025-12-14T16:05:03.422Z -INFO vmware-vmx.exe 22116 [ws@4413 threadName="vcpu-0"] SCSI DEVICE (scsi0:0): MODE SENSE(6) for unsupported page 0x8
2025-12-14T16:05:03.422Z -INFO vmware-vmx.exe 22116 [ws@4413 threadName="vcpu-0"] SCSI DEVICE (scsi0:0): MODE SENSE(6) for unsupported page 0x8
2025-12-14T16:05:03.424Z -INFO vmware-vmx.exe 22116 [ws@4413 threadName="vcpu-1"] SCSI DEVICE (scsi0:0): MODE SENSE(6) for unsupported page 0x8
2025-12-14T16:05:03.424Z -INFO vmware-vmx.exe 22116 [ws@4413 threadName="vcpu-1"] SCSI DEVICE (scsi0:0): MODE SENSE(6) for unsupported page 0x8
2025-12-14T16:05:03.425Z -INFO vmware-vmx.exe 22116 [ws@4413 threadName="vcpu-0"] SCSI DEVICE (scsi0:0): MODE SENSE(6) for unsupported page 0x8
2025-12-14T16:05:03.425Z -INFO vmware-vmx.exe 22116 [ws@4413 threadName="vcpu-0"] SCSI DEVICE (scsi0:0): MODE SENSE(6) for unsupported page 0x8
2025-12-14T16:05:06.507Z -INFO vmware-vmx.exe 22116 [ws@4413 threadName="vmx"] MemSched: caller 0 numvm 1 locked pages: num 1365753 max 6957786
2025-12-14T16:05:06.507Z -INFO vmware-vmx.exe 22116 [ws@4413 threadName="vmx"] MemSched: locked Page Limit: host 6965978 config 7272704
2025-12-14T16:05:06.507Z -INFO vmware-vmx.exe 22116 [ws@4413 threadName="vmx"] MemSched: minmempct 50 timestamp 30817
2025-12-14T16:05:06.507Z -INFO vmware-vmx.exe 22116 [ws@4413 threadName="vmx"] MemSched: VM 0 min 799432 max 1585864 shares 1572864 paged 1330494 nonpaged 5264 anonymous 7736 locked 1365753 touchedPct 13 dirtiedPct 4 timestamp 30817 vmResponsive is 1
2025-12-14T16:05:06.507Z -INFO vmware-vmx.exe 22116 [ws@4413 threadName="vmx"] MemSched: locked 1365753 target 1585864 balloon 0 0 1022361 swapped 216060 0 allocd 1 512 state 0 100
2025-12-14T16:05:06.507Z -INFO vmware-vmx.exe 22116 [ws@4413 threadName="vmx"] MemSched: states: 0 25201 : 1 0 : 2 0 : 3 0
2025-12-14T16:05:06.507Z -INFO vmware-vmx.exe 22116 [ws@4413 threadName="vmx"] MemSched: Balloon enabled 1 guestType 4 maxSize 0
2025-12-14T16:11:11.908Z -INFO vmware-vmx.exe 22116 [ws@4413 threadName="vcpu-0"] SCSI DEVICE (scsi0:0): MODE SENSE(6) for unsupported page 0x8
2025-12-14T16:11:11.909Z -INFO vmware-vmx.exe 22116 [ws@4413 threadName="vcpu-0"] SCSI DEVICE (scsi0:0): MODE SENSE(6) for unsupported page 0x8
2025-12-14T16:11:11.909Z -INFO vmware-vmx.exe 22116 [ws@4413 threadName="vcpu-0"] DISKUTIL: scsi0:0 : capacity=83886080 logical sector size=512
2025-12-14T16:11:11.914Z -INFO vmware-vmx.exe 22116 [ws@4413 threadName="vcpu-0"] CDROM: Emulate GET CONFIGURATION RT 0 starting feature 0
2025-12-14T16:11:41.535Z -INFO vmware-vmx.exe 22116 [ws@4413 threadName="vmx"] CPClipboard_SetItem: Set CPClipboard struct with data of size:1933, format:1.
2025-12-14T16:13:09.475Z -INFO vmware-vmx.exe 22116 [ws@4413 threadName="vmx"] CPClipboard_SetItem: Set CPClipboard struct with data of size:13, format:1.
2025-12-14T16:15:46.902Z -INFO vmware-vmx.exe 22116 [ws@4413 threadName="vmx"] CPClipboard_SetItem: Set CPClipboard struct with data of size:486, format:1.
2025-12-14T16:16:38.890Z -INFO vmware-vmx.exe 22116 [ws@4413 threadName="vmx"] CPClipboard_SetItem: Set CPClipboard struct with data of size:78084, format:6.
2025-12-14T16:17:01.860Z -INFO vmware-vmx.exe 22116 [ws@4413 threadName="vmx"] CPClipboard_SetItem: Set CPClipboard struct with data of size:78084, format:6.
2025-12-14T16:21:16.224Z -INFO vmware-vmx.exe 22116 [ws@4413 threadName="vcpu-1"] SCSI DEVICE (scsi0:0): MODE SENSE(6) for unsupported page 0x8
2025-12-14T16:21:16.224Z -INFO vmware-vmx.exe 22116 [ws@4413 threadName="vcpu-1"] SCSI DEVICE (scsi0:0): MODE SENSE(6) for unsupported page 0x8
2025-12-14T16:21:16.227Z -INFO vmware-vmx.exe 22116 [ws@4413 threadName="vcpu-1"] SCSI DEVICE (scsi0:0): MODE SENSE(6) for unsupported page 0x8
2025-12-14T16:21:16.227Z -INFO vmware-vmx.exe 22116 [ws@4413 threadName="vcpu-1"] SCSI DEVICE (scsi0:0): MODE SENSE(6) for unsupported page 0x8
2025-12-14T16:21:16.231Z -INFO vmware-vmx.exe 22116 [ws@4413 threadName="vcpu-0"] SCSI DEVICE (scsi0:0): MODE SENSE(6) for unsupported page 0x8
2025-12-14T16:21:16.231Z -INFO vmware-vmx.exe 22116 [ws@4413 threadName="vcpu-0"] SCSI DEVICE (scsi0:0): MODE SENSE(6) for unsupported page 0x8
2025-12-14T16:21:16.234Z -INFO vmware-vmx.exe 22116 [ws@4413 threadName="vcpu-1"] SCSI DEVICE (scsi0:0): MODE SENSE(6) for unsupported page 0x8
2025-12-14T16:21:16.234Z -INFO vmware-vmx.exe 22116 [ws@4413 threadName="vcpu-1"] SCSI DEVICE (scsi0:0): MODE SENSE(6) for unsupported page 0x8
2025-12-14T16:21:16.239Z -INFO vmware-vmx.exe 22116 [ws@4413 threadName="vcpu-0"] SCSI DEVICE (scsi0:0): MODE SENSE(6) for unsupported page 0x8
2025-12-14T16:21:16.239Z -INFO vmware-vmx.exe 22116 [ws@4413 threadName="vcpu-0"] SCSI DEVICE (scsi0:0): MODE SENSE(6) for unsupported page 0x8
2025-12-14T16:21:16.241Z -INFO vmware-vmx.exe 22116 [ws@4413 threadName="vcpu-0"] SCSI DEVICE (scsi0:0): MODE SENSE(6) for unsupported page 0x8
2025-12-14T16:21:16.241Z -INFO vmware-vmx.exe 22116 [ws@4413 threadName="vcpu-0"] SCSI DEVICE (scsi0:0): MODE SENSE(6) for unsupported page 0x8
2025-12-14T16:22:17.466Z -INFO vmware-vmx.exe 22116 [ws@4413 threadName="vcpu-1"] SCSI DEVICE (scsi0:0): MODE SENSE(6) for unsupported page 0x8
2025-12-14T16:22:17.466Z -INFO vmware-vmx.exe 22116 [ws@4413 threadName="vcpu-1"] SCSI DEVICE (scsi0:0): MODE SENSE(6) for unsupported page 0x8
2025-12-14T16:22:17.466Z -INFO vmware-vmx.exe 22116 [ws@4413 threadName="vcpu-1"] DISKUTIL: scsi0:0 : capacity=83886080 logical sector size=512
2025-12-14T16:22:17.470Z -INFO vmware-vmx.exe 22116 [ws@4413 threadName="vcpu-0"] CDROM: Emulate GET CONFIGURATION RT 0 starting feature 0
2025-12-14T16:27:10.767Z -INFO vmware-vmx.exe 22116 [ws@4413 threadName="vmx"] CPClipboard_SetItem: Set CPClipboard struct with data of size:50, format:1.
2025-12-14T16:33:45.423Z -INFO vmware-vmx.exe 22116 [ws@4413 threadName="vmx"] CPClipboard_SetItem: Set CPClipboard struct with data of size:185, format:1.
2025-12-14T16:35:07.250Z -INFO vmware-vmx.exe 22116 [ws@4413 threadName="vmx"] MemSched: caller 0 numvm 1 locked pages: num 1351664 max 7127365
2025-12-14T16:35:07.250Z -INFO vmware-vmx.exe 22116 [ws@4413 threadName="vmx"] MemSched: locked Page Limit: host 7135557 config 7272704
2025-12-14T16:35:07.250Z -INFO vmware-vmx.exe 22116 [ws@4413 threadName="vmx"] MemSched: minmempct 50 timestamp 32618
2025-12-14T16:35:07.250Z -INFO vmware-vmx.exe 22116 [ws@4413 threadName="vmx"] MemSched: VM 0 min 799432 max 1585864 shares 1572864 paged 1330494 nonpaged 5264 anonymous 7736 locked 1351664 touchedPct 18 dirtiedPct 5 timestamp 32618 vmResponsive is 1
2025-12-14T16:35:07.250Z -INFO vmware-vmx.exe 22116 [ws@4413 threadName="vmx"] MemSched: locked 1351664 target 1585864 balloon 0 0 1022361 swapped 230144 0 allocd 2 512 state 0 100
2025-12-14T16:35:07.250Z -INFO vmware-vmx.exe 22116 [ws@4413 threadName="vmx"] MemSched: states: 0 27001 : 1 0 : 2 0 : 3 0
2025-12-14T16:35:07.250Z -INFO vmware-vmx.exe 22116 [ws@4413 threadName="vmx"] MemSched: Balloon enabled 1 guestType 4 maxSize 0
2025-12-14T16:40:03.547Z -INFO vmware-vmx.exe 22116 [ws@4413 threadName="vmx"] CPClipboard_SetItem: Set CPClipboard struct with data of size:2238, format:1.
2025-12-14T16:40:03.547Z -INFO vmware-vmx.exe 22116 [ws@4413 threadName="vmx"] CPClipboard_SetItem: Set CPClipboard struct with data of size:50742, format:3.
2025-12-14T16:43:50.624Z -INFO vmware-vmx.exe 22116 [ws@4413 threadName="vmx"] CPClipboard_SetItem: Set CPClipboard struct with data of size:2238, format:1.
2025-12-14T16:43:50.624Z -INFO vmware-vmx.exe 22116 [ws@4413 threadName="vmx"] CPClipboard_SetItem: Set CPClipboard struct with data of size:50740, format:3.
2025-12-14T16:44:51.721Z -INFO vmware-vmx.exe 22116 [ws@4413 threadName="vcpu-1"] SOUNDLIB: Creating WAVE backend stream.
2025-12-14T16:44:51.725Z -INFO vmware-vmx.exe 22116 [ws@4413 threadName="vcpu-1"] SOUNDLIB: SoundWaveSelectHostDevice: Found device Headset Earphone (Logitech Mono
2025-12-14T16:44:51.826Z -INFO vmware-vmx.exe 22116 [ws@4413 threadName="vcpu-1"] SOUNDLIB: SoundWaveComputeBufferParams: Initializing 10 buffers of length 3840, capable of holding a total of 200000 usecs of sound.
2025-12-14T16:44:51.827Z -INFO vmware-vmx.exe 22116 [ws@4413 threadName="soundWavePlayback21"] VTHREAD 31848 "soundWavePlayback21"
2025-12-14T16:44:51.827Z -INFO vmware-vmx.exe 22116 [ws@4413 threadName="soundWavePlayback21"] SOUNDLIB: SoundWaveThread: Poll thread entered : id(31848)
2025-12-14T16:44:51.827Z -INFO vmware-vmx.exe 22116 [ws@4413 threadName="vcpu-1"] SOUNDLIB: SoundWaveCreateStream: Created poll thread : id(31848)
2025-12-14T16:44:51.838Z -INFO vmware-vmx.exe 22116 [ws@4413 threadName="vcpu-0"] SOUNDLIB: Starting WAVE stream 2200889C9E0.
2025-12-14T16:44:53.441Z -INFO vmware-vmx.exe 22116 [ws@4413 threadName="vmx"] SOUNDLIB: Stopping WAVE stream 2200889C9E0.
2025-12-14T16:44:53.451Z -INFO vmware-vmx.exe 22116 [ws@4413 threadName="soundWavePlayback21"] SOUNDLIB: SoundWavePoll: Poll invoked on a non-running stream; leaving early.
2025-12-14T16:44:53.452Z -INFO vmware-vmx.exe 22116 [ws@4413 threadName="vmx"] SOUNDLIB: Closing WAVE stream 2200889C9E0.
2025-12-14T16:44:53.452Z -INFO vmware-vmx.exe 22116 [ws@4413 threadName="vmx"] SOUNDLIB: SoundWaveCloseStream: Destroying poll thread : id(31848)
2025-12-14T16:44:53.452Z -INFO vmware-vmx.exe 22116 [ws@4413 threadName="soundWavePlayback21"] SOUNDLIB: SoundWaveThread: Poll thread exited : id(31848)
2025-12-14T16:52:47.597Z -INFO vmware-vmx.exe 22116 [ws@4413 threadName="vmx"] CPClipboard_SetItem: Set CPClipboard struct with data of size:2238, format:1.
2025-12-14T16:52:47.597Z -INFO vmware-vmx.exe 22116 [ws@4413 threadName="vmx"] CPClipboard_SetItem: Set CPClipboard struct with data of size:50740, format:3.
2025-12-14T16:56:48.483Z -INFO vmware-vmx.exe 22116 [ws@4413 threadName="vcpu-0"] SCSI DEVICE (scsi0:0): MODE SENSE(6) for unsupported page 0x8
2025-12-14T16:56:48.483Z -INFO vmware-vmx.exe 22116 [ws@4413 threadName="vcpu-0"] SCSI DEVICE (scsi0:0): MODE SENSE(6) for unsupported page 0x8
2025-12-14T16:56:48.485Z -INFO vmware-vmx.exe 22116 [ws@4413 threadName="vcpu-0"] SCSI DEVICE (scsi0:0): MODE SENSE(6) for unsupported page 0x8
2025-12-14T16:56:48.485Z -INFO vmware-vmx.exe 22116 [ws@4413 threadName="vcpu-0"] SCSI DEVICE (scsi0:0): MODE SENSE(6) for unsupported page 0x8
2025-12-14T16:56:48.489Z -INFO vmware-vmx.exe 22116 [ws@4413 threadName="vcpu-0"] SCSI DEVICE (scsi0:0): MODE SENSE(6) for unsupported page 0x8
2025-12-14T16:56:48.489Z -INFO vmware-vmx.exe 22116 [ws@4413 threadName="vcpu-0"] SCSI DEVICE (scsi0:0): MODE SENSE(6) for unsupported page 0x8
2025-12-14T16:56:48.491Z -INFO vmware-vmx.exe 22116 [ws@4413 threadName="vcpu-1"] SCSI DEVICE (scsi0:0): MODE SENSE(6) for unsupported page 0x8
2025-12-14T16:56:48.491Z -INFO vmware-vmx.exe 22116 [ws@4413 threadName="vcpu-1"] SCSI DEVICE (scsi0:0): MODE SENSE(6) for unsupported page 0x8
2025-12-14T16:56:48.493Z -INFO vmware-vmx.exe 22116 [ws@4413 threadName="vcpu-0"] SCSI DEVICE (scsi0:0): MODE SENSE(6) for unsupported page 0x8
2025-12-14T16:56:48.493Z -INFO vmware-vmx.exe 22116 [ws@4413 threadName="vcpu-0"] SCSI DEVICE (scsi0:0): MODE SENSE(6) for unsupported page 0x8
2025-12-14T16:56:48.495Z -INFO vmware-vmx.exe 22116 [ws@4413 threadName="vcpu-1"] SCSI DEVICE (scsi0:0): MODE SENSE(6) for unsupported page 0x8
2025-12-14T16:56:48.495Z -INFO vmware-vmx.exe 22116 [ws@4413 threadName="vcpu-1"] SCSI DEVICE (scsi0:0): MODE SENSE(6) for unsupported page 0x8
2025-12-14T16:57:47.879Z -INFO vmware-vmx.exe 22116 [ws@4413 threadName="vmx"] CPClipboard_SetItem: Set CPClipboard struct with data of size:135, format:1.
2025-12-14T17:05:07.816Z -INFO vmware-vmx.exe 22116 [ws@4413 threadName="vmx"] MemSched: caller 0 numvm 1 locked pages: num 1331937 max 7170882
2025-12-14T17:05:07.816Z -INFO vmware-vmx.exe 22116 [ws@4413 threadName="vmx"] MemSched: locked Page Limit: host 7179074 config 7272704
2025-12-14T17:05:07.816Z -INFO vmware-vmx.exe 22116 [ws@4413 threadName="vmx"] MemSched: minmempct 50 timestamp 34418
2025-12-14T17:05:07.816Z -INFO vmware-vmx.exe 22116 [ws@4413 threadName="vmx"] MemSched: VM 0 min 799432 max 1585864 shares 1572864 paged 1330494 nonpaged 5264 anonymous 7736 locked 1331937 touchedPct 19 dirtiedPct 6 timestamp 34418 vmResponsive is 1
2025-12-14T17:05:07.816Z -INFO vmware-vmx.exe 22116 [ws@4413 threadName="vmx"] MemSched: locked 1331937 target 1585864 balloon 0 0 1022361 swapped 249865 0 allocd 99 512 state 0 100
2025-12-14T17:05:07.816Z -INFO vmware-vmx.exe 22116 [ws@4413 threadName="vmx"] MemSched: states: 0 28801 : 1 0 : 2 0 : 3 0
2025-12-14T17:05:07.816Z -INFO vmware-vmx.exe 22116 [ws@4413 threadName="vmx"] MemSched: Balloon enabled 1 guestType 4 maxSize 0
2025-12-14T17:05:15.542Z -INFO vmware-vmx.exe 22116 [ws@4413 threadName="vcpu-0"] SOUNDLIB: Creating WAVE backend stream.
2025-12-14T17:05:15.546Z -INFO vmware-vmx.exe 22116 [ws@4413 threadName="vcpu-0"] SOUNDLIB: SoundWaveSelectHostDevice: Found device Headset Earphone (Logitech Mono
2025-12-14T17:05:15.613Z -INFO vmware-vmx.exe 22116 [ws@4413 threadName="vcpu-0"] SOUNDLIB: SoundWaveComputeBufferParams: Initializing 10 buffers of length 3840, capable of holding a total of 200000 usecs of sound.
2025-12-14T17:05:15.613Z -INFO vmware-vmx.exe 22116 [ws@4413 threadName="soundWavePlayback22"] VTHREAD 27956 "soundWavePlayback22"
2025-12-14T17:05:15.613Z -INFO vmware-vmx.exe 22116 [ws@4413 threadName="soundWavePlayback22"] SOUNDLIB: SoundWaveThread: Poll thread entered : id(27956)
2025-12-14T17:05:15.613Z -INFO vmware-vmx.exe 22116 [ws@4413 threadName="vcpu-0"] SOUNDLIB: SoundWaveCreateStream: Created poll thread : id(27956)
2025-12-14T17:05:15.624Z -INFO vmware-vmx.exe 22116 [ws@4413 threadName="vcpu-0"] SOUNDLIB: Starting WAVE stream 2200889BAE0.
2025-12-14T17:05:17.233Z -INFO vmware-vmx.exe 22116 [ws@4413 threadName="vmx"] SOUNDLIB: Stopping WAVE stream 2200889BAE0.
2025-12-14T17:05:17.244Z -INFO vmware-vmx.exe 22116 [ws@4413 threadName="soundWavePlayback22"] SOUNDLIB: SoundWavePoll: Poll invoked on a non-running stream; leaving early.
2025-12-14T17:05:17.246Z -INFO vmware-vmx.exe 22116 [ws@4413 threadName="vmx"] SOUNDLIB: Closing WAVE stream 2200889BAE0.
2025-12-14T17:05:17.246Z -INFO vmware-vmx.exe 22116 [ws@4413 threadName="vmx"] SOUNDLIB: SoundWaveCloseStream: Destroying poll thread : id(27956)
2025-12-14T17:05:17.246Z -INFO vmware-vmx.exe 22116 [ws@4413 threadName="soundWavePlayback22"] SOUNDLIB: SoundWaveThread: Poll thread exited : id(27956)
2025-12-14T17:05:40.422Z -INFO vmware-vmx.exe 22116 [ws@4413 threadName="vcpu-1"] SOUNDLIB: Creating WAVE backend stream.
2025-12-14T17:05:40.424Z -INFO vmware-vmx.exe 22116 [ws@4413 threadName="vcpu-1"] SOUNDLIB: SoundWaveSelectHostDevice: Found device Headset Earphone (Logitech Mono
2025-12-14T17:05:40.449Z -INFO vmware-vmx.exe 22116 [ws@4413 threadName="vcpu-1"] SOUNDLIB: SoundWaveComputeBufferParams: Initializing 10 buffers of length 3840, capable of holding a total of 200000 usecs of sound.
2025-12-14T17:05:40.450Z -INFO vmware-vmx.exe 22116 [ws@4413 threadName="soundWavePlayback23"] VTHREAD 26200 "soundWavePlayback23"
2025-12-14T17:05:40.450Z -INFO vmware-vmx.exe 22116 [ws@4413 threadName="soundWavePlayback23"] SOUNDLIB: SoundWaveThread: Poll thread entered : id(26200)
2025-12-14T17:05:40.450Z -INFO vmware-vmx.exe 22116 [ws@4413 threadName="vcpu-1"] SOUNDLIB: SoundWaveCreateStream: Created poll thread : id(26200)
2025-12-14T17:05:40.460Z -INFO vmware-vmx.exe 22116 [ws@4413 threadName="vcpu-0"] SOUNDLIB: Starting WAVE stream 2200889B220.
2025-12-14T17:05:42.120Z -INFO vmware-vmx.exe 22116 [ws@4413 threadName="vmx"] SOUNDLIB: Stopping WAVE stream 2200889B220.
2025-12-14T17:05:42.131Z -INFO vmware-vmx.exe 22116 [ws@4413 threadName="soundWavePlayback23"] SOUNDLIB: SoundWavePoll: Poll invoked on a non-running stream; leaving early.
2025-12-14T17:05:42.132Z -INFO vmware-vmx.exe 22116 [ws@4413 threadName="vmx"] SOUNDLIB: Closing WAVE stream 2200889B220.
2025-12-14T17:05:42.132Z -INFO vmware-vmx.exe 22116 [ws@4413 threadName="vmx"] SOUNDLIB: SoundWaveCloseStream: Destroying poll thread : id(26200)
2025-12-14T17:05:42.132Z -INFO vmware-vmx.exe 22116 [ws@4413 threadName="soundWavePlayback23"] SOUNDLIB: SoundWaveThread: Poll thread exited : id(26200)
2025-12-14T17:05:57.927Z -INFO vmware-vmx.exe 22116 [ws@4413 threadName="vcpu-1"] SOUNDLIB: Creating WAVE backend stream.
2025-12-14T17:05:57.929Z -INFO vmware-vmx.exe 22116 [ws@4413 threadName="vcpu-1"] SOUNDLIB: SoundWaveSelectHostDevice: Found device Headset Earphone (Logitech Mono
2025-12-14T17:05:57.943Z -INFO vmware-vmx.exe 22116 [ws@4413 threadName="vcpu-1"] SOUNDLIB: SoundWaveComputeBufferParams: Initializing 9 buffers of length 3584, capable of holding a total of 182857 usecs of sound.
2025-12-14T17:05:57.944Z -INFO vmware-vmx.exe 22116 [ws@4413 threadName="soundWaveRecord7"] VTHREAD 31640 "soundWaveRecord7"
2025-12-14T17:05:57.944Z -INFO vmware-vmx.exe 22116 [ws@4413 threadName="soundWaveRecord7"] SOUNDLIB: SoundWaveThread: Poll thread entered : id(31640)
2025-12-14T17:05:57.944Z -INFO vmware-vmx.exe 22116 [ws@4413 threadName="vcpu-1"] SOUNDLIB: SoundWaveCreateStream: Created poll thread : id(31640)
2025-12-14T17:05:57.944Z -INFO vmware-vmx.exe 22116 [ws@4413 threadName="vcpu-1"] SOUNDLIB: Starting WAVE stream 2200889C9E0.
2025-12-14T17:05:58.011Z -INFO vmware-vmx.exe 22116 [ws@4413 threadName="vcpu-0"] SOUNDLIB: Creating WAVE backend stream.
2025-12-14T17:05:58.013Z -INFO vmware-vmx.exe 22116 [ws@4413 threadName="vcpu-0"] SOUNDLIB: SoundWaveSelectHostDevice: Found device Headset Earphone (Logitech Mono
2025-12-14T17:05:58.027Z -INFO vmware-vmx.exe 22116 [ws@4413 threadName="vcpu-0"] SOUNDLIB: SoundWaveComputeBufferParams: Initializing 10 buffers of length 3840, capable of holding a total of 200000 usecs of sound.
2025-12-14T17:05:58.028Z -INFO vmware-vmx.exe 22116 [ws@4413 threadName="soundWavePlayback24"] VTHREAD 8396 "soundWavePlayback24"
2025-12-14T17:05:58.028Z -INFO vmware-vmx.exe 22116 [ws@4413 threadName="soundWavePlayback24"] SOUNDLIB: SoundWaveThread: Poll thread entered : id(8396)
2025-12-14T17:05:58.028Z -INFO vmware-vmx.exe 22116 [ws@4413 threadName="vcpu-0"] SOUNDLIB: SoundWaveCreateStream: Created poll thread : id(8396)
2025-12-14T17:05:58.031Z -INFO vmware-vmx.exe 22116 [ws@4413 threadName="vcpu-0"] SOUNDLIB: Starting WAVE stream 2200889B860.
2025-12-14T17:06:23.990Z -INFO vmware-vmx.exe 22116 [ws@4413 threadName="vcpu-0"] SOUNDLIB: Stopping WAVE stream 2200889C9E0.
2025-12-14T17:06:23.990Z -INFO vmware-vmx.exe 22116 [ws@4413 threadName="soundWaveRecord7"] SOUNDLIB: SoundWavePoll: Poll invoked on a non-running stream; leaving early.
2025-12-14T17:06:23.997Z -INFO vmware-vmx.exe 22116 [ws@4413 threadName="vcpu-0"] SOUNDLIB: Closing WAVE stream 2200889C9E0.
2025-12-14T17:06:23.997Z -INFO vmware-vmx.exe 22116 [ws@4413 threadName="vcpu-0"] SOUNDLIB: SoundWaveCloseStream: Destroying poll thread : id(31640)
2025-12-14T17:06:23.997Z -INFO vmware-vmx.exe 22116 [ws@4413 threadName="soundWaveRecord7"] SOUNDLIB: SoundWaveThread: Poll thread exited : id(31640)
2025-12-14T17:06:24.483Z -INFO vmware-vmx.exe 22116 [ws@4413 threadName="vmx"] SOUNDLIB: Stopping WAVE stream 2200889B860.
2025-12-14T17:06:24.493Z -INFO vmware-vmx.exe 22116 [ws@4413 threadName="soundWavePlayback24"] SOUNDLIB: SoundWavePoll: Poll invoked on a non-running stream; leaving early.
2025-12-14T17:06:24.495Z -INFO vmware-vmx.exe 22116 [ws@4413 threadName="vmx"] SOUNDLIB: Closing WAVE stream 2200889B860.
2025-12-14T17:06:24.495Z -INFO vmware-vmx.exe 22116 [ws@4413 threadName="vmx"] SOUNDLIB: SoundWaveCloseStream: Destroying poll thread : id(8396)
2025-12-14T17:06:24.495Z -INFO vmware-vmx.exe 22116 [ws@4413 threadName="soundWavePlayback24"] SOUNDLIB: SoundWaveThread: Poll thread exited : id(8396)
2025-12-14T17:19:11.247Z -INFO vmware-vmx.exe 22116 [ws@4413 threadName="vcpu-1"] SCSI DEVICE (scsi0:0): MODE SENSE(6) for unsupported page 0x8
2025-12-14T17:19:11.247Z -INFO vmware-vmx.exe 22116 [ws@4413 threadName="vcpu-1"] SCSI DEVICE (scsi0:0): MODE SENSE(6) for unsupported page 0x8
2025-12-14T17:19:11.249Z -INFO vmware-vmx.exe 22116 [ws@4413 threadName="vcpu-0"] SCSI DEVICE (scsi0:0): MODE SENSE(6) for unsupported page 0x8
2025-12-14T17:19:11.249Z -INFO vmware-vmx.exe 22116 [ws@4413 threadName="vcpu-0"] SCSI DEVICE (scsi0:0): MODE SENSE(6) for unsupported page 0x8
2025-12-14T17:19:11.251Z -INFO vmware-vmx.exe 22116 [ws@4413 threadName="vcpu-0"] SCSI DEVICE (scsi0:0): MODE SENSE(6) for unsupported page 0x8
2025-12-14T17:19:11.251Z -INFO vmware-vmx.exe 22116 [ws@4413 threadName="vcpu-0"] SCSI DEVICE (scsi0:0): MODE SENSE(6) for unsupported page 0x8
2025-12-14T17:19:11.253Z -INFO vmware-vmx.exe 22116 [ws@4413 threadName="vcpu-1"] SCSI DEVICE (scsi0:0): MODE SENSE(6) for unsupported page 0x8
2025-12-14T17:19:11.253Z -INFO vmware-vmx.exe 22116 [ws@4413 threadName="vcpu-1"] SCSI DEVICE (scsi0:0): MODE SENSE(6) for unsupported page 0x8
2025-12-14T17:19:11.255Z -INFO vmware-vmx.exe 22116 [ws@4413 threadName="vcpu-0"] SCSI DEVICE (scsi0:0): MODE SENSE(6) for unsupported page 0x8
2025-12-14T17:19:11.255Z -INFO vmware-vmx.exe 22116 [ws@4413 threadName="vcpu-0"] SCSI DEVICE (scsi0:0): MODE SENSE(6) for unsupported page 0x8
2025-12-14T17:19:11.257Z -INFO vmware-vmx.exe 22116 [ws@4413 threadName="vcpu-0"] SCSI DEVICE (scsi0:0): MODE SENSE(6) for unsupported page 0x8
2025-12-14T17:19:11.257Z -INFO vmware-vmx.exe 22116 [ws@4413 threadName="vcpu-0"] SCSI DEVICE (scsi0:0): MODE SENSE(6) for unsupported page 0x8